

5. Case study: Assessment of Biodiversity Conservation Potential of ISFM in Northern Ghana


Biodiversity data were analyzed using Hill diversity indices. The Hill numbers “H(q)” is given by:
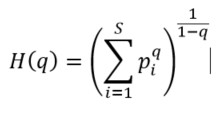
where “H(q)” is the Hill number at order “q” , “S” is the total number of species in the community, “q” is the order of diversity and “Pi” is the proportional abundance of species “i”.
The proportional abundance “pi” is given by:

where “ni” is the abundance of species “i”, and “N” is the total abundance of all individuals in the community.
Diversity profiles were constructed by computing Hill numbers across a continuous range from 0 to 4 of values (Chao et al., 2014) to assess the contribution of rare and dominant taxa and to enable direct comparison of biodiversity patterns among land-use systems and across the different stages of the cropping cycle. These profiles were plotted to visualize the full spectrum of biodiversity within each land use type, cropping stage, and ecological stratum. Differences among land-use types and cropping stages were visualized using diversity profiles (Figure 12), allowing clear interpretation of biodiversity responses to management practices.
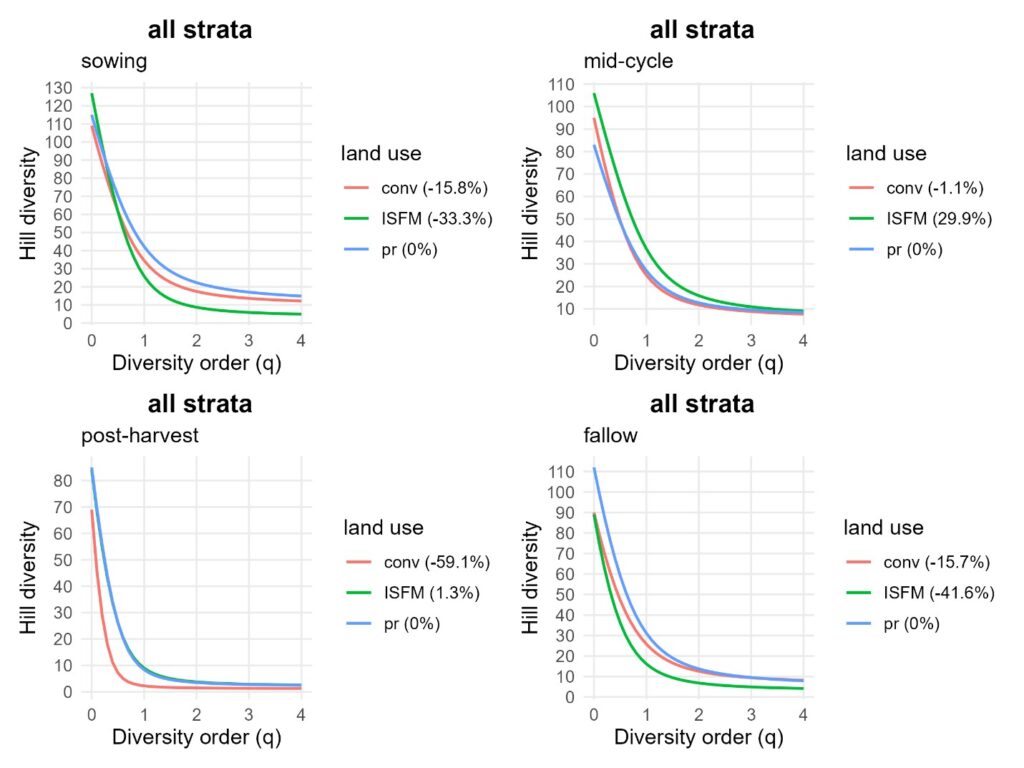
Hill diversity profiles by cropping stage across all strata combined. Conventional intensification (conv, red), ISFM (green), and baseline Guinea Savannah (pr, blue). Values in parentheses represent the percentage change in area under the diversity profile curve (∆AUC) relative to the baseline (pr).
Biodiversity conservation potentials (Figure 12) were quantified using two complementary indicators. The first, percentage area under the curve ( ), represents the AUC of a specific treatment (e.g., land use) relative to a selected baseline reference. The second, percentage change in AUC ( ), measures the relative increase or decrease in biodiversity conservation potential compared with the same reference condition. Positive percentage changes indicate higher conservation potential than the reference, whereas negative values reflect biodiversity decline.
This approach enabled comparison of land-use systems based on their relative capacity to conserve biodiversity. Results were reported with appropriate consideration of uncertainty and interpreted in a policy-relevant context to support land-use planning and biodiversity conservation decision-making.