


Time Estimate: “Complete this lesson in 30 – 45 minutes.”
Instructions:
- Click through interactive blocks to explore details.
- Test your knowledge with assessment tasks at the end of each lesson.
Keep these definitions in mind, we will come back to the key terms and concepts in this lesson.
Remote Sensing is the use of electromagnetic radiation sensors to record images of the environment, which can be interpreted to yield useful information (Curran 1985).
Detection or recording of objects from a distance, without direct contact of the recording system, the so-called sensor, with the object to be explored (Kronberg 1985).

👍 Pros
- Large spatial coverage
- Comprehensive coverage (without temporal gaps)
- Physical measurements even in hardly accessible regions
- Regular orbit (repeated acquisitions)
- Objective measurements
- High degree of automation
- Archiving function (“memory”)
- Cheap (in terms of operation)
- Many applications would not be possible with field recordings (alone)
- Dramatically increasing availability of free data
👎 Cons
- Expensive (in terms of development and launch)
- Technological limitations (e.g. signal-to-noise ratio, SNR)
- Complex data processing (usually automated)
- Indirect measurements that entail uncertainties (models, e.g., spectral indices as proxy of vegetation cover)
Many phenomena on the Earth’s surface and even in the atmosphere can be detected and monitored with remote sensing. Find here frequent fields of application:
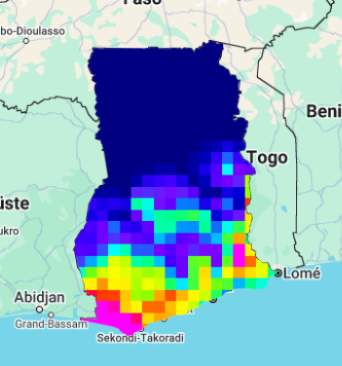
Climatology
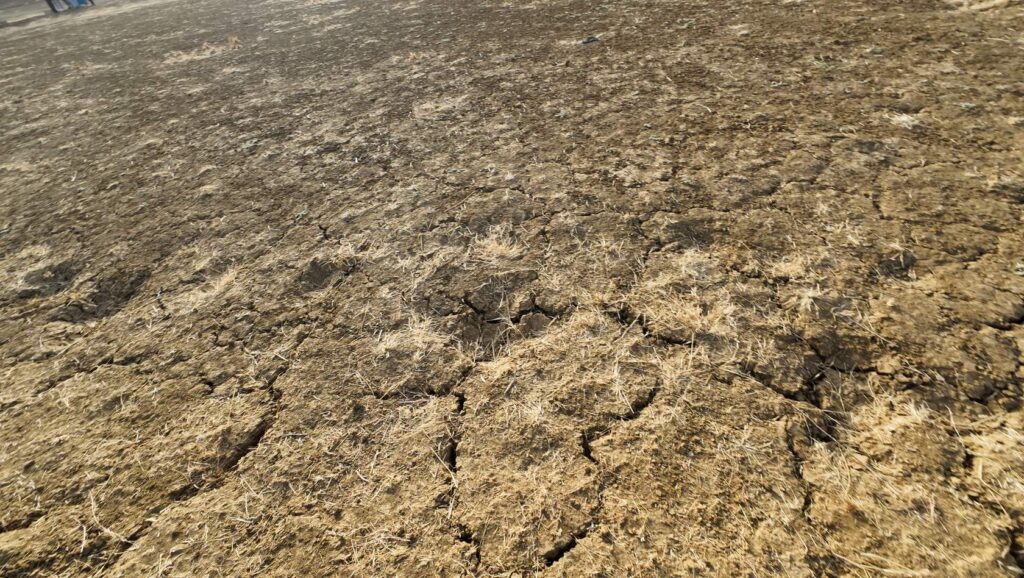
Land degradation
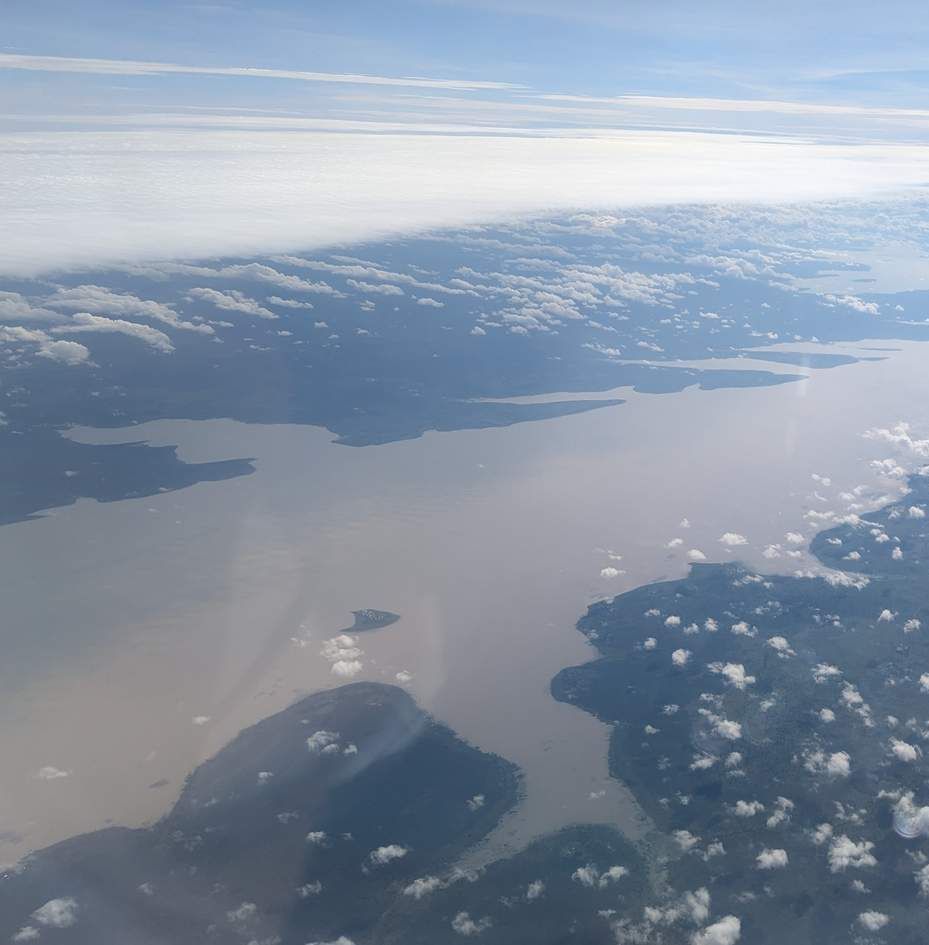
Water resources
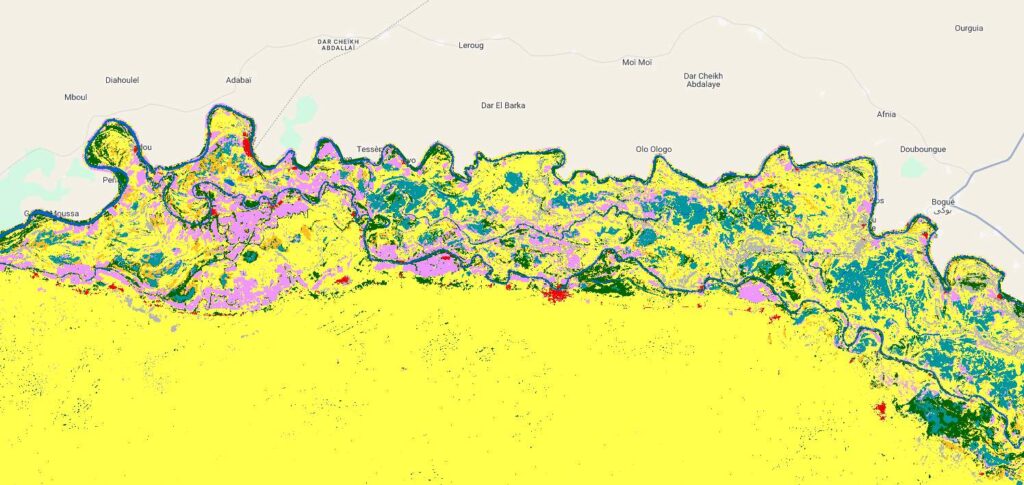
Land use/Land cover
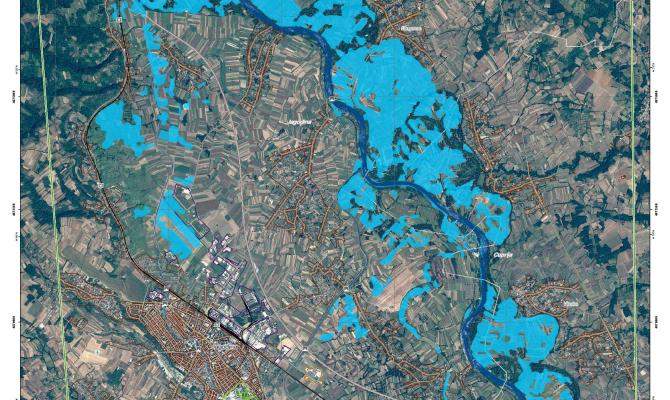
Hazards
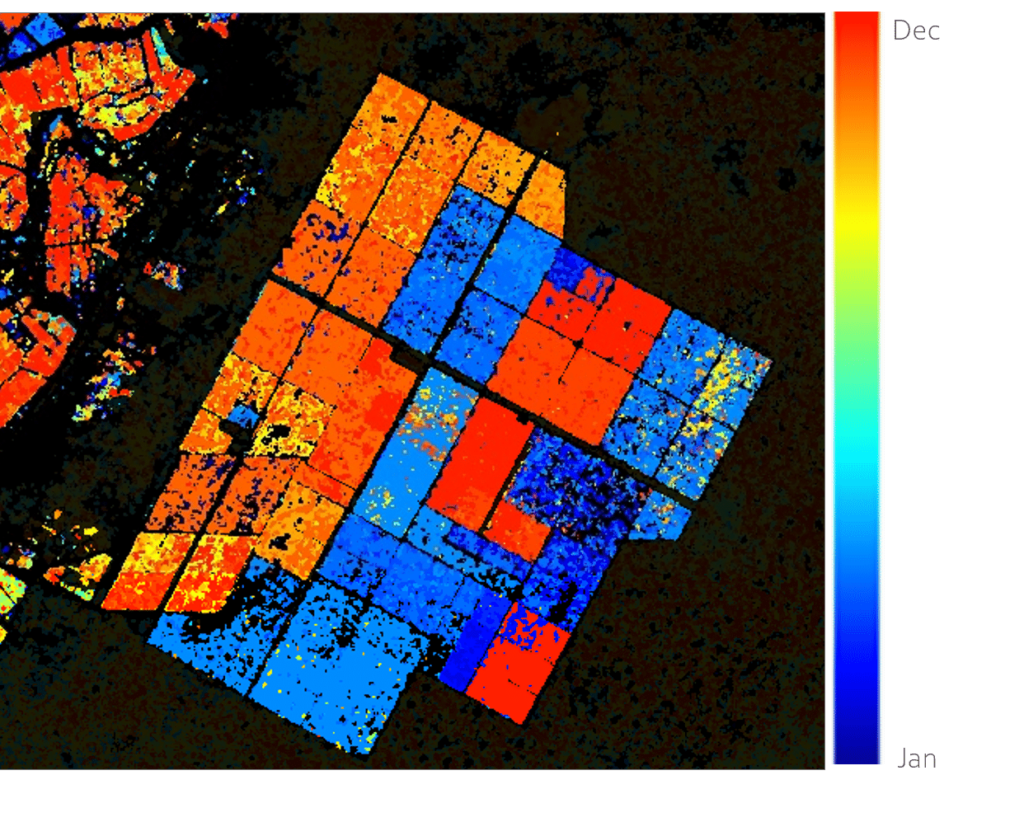
Agriculture
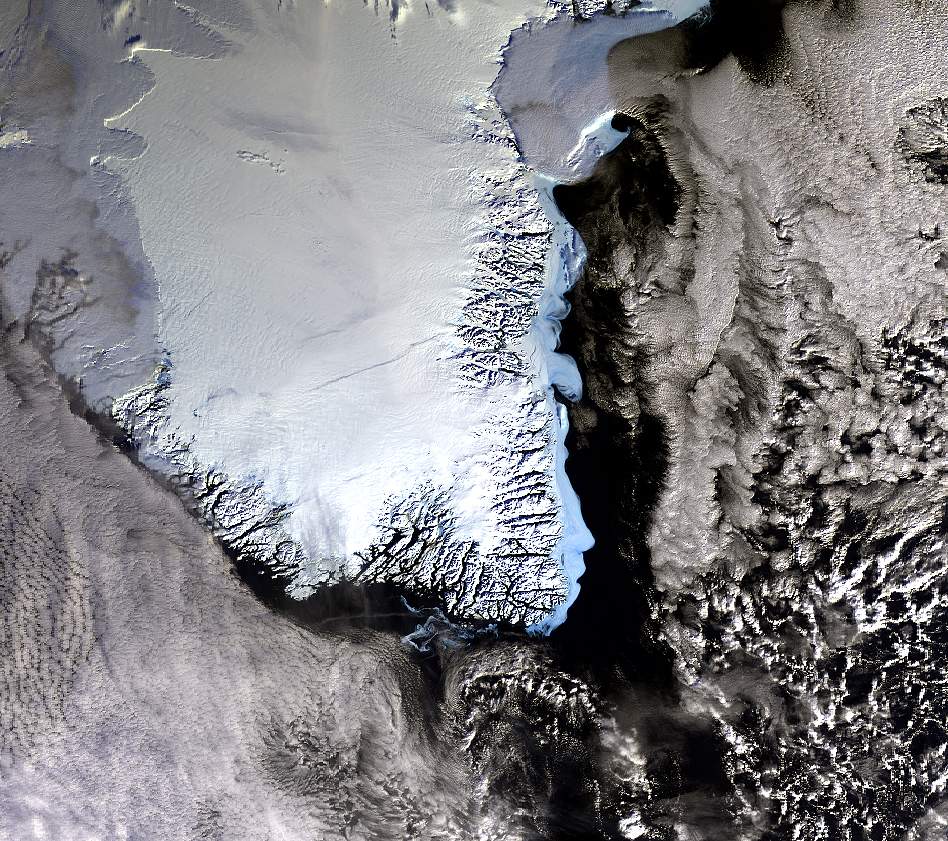
Glaciology
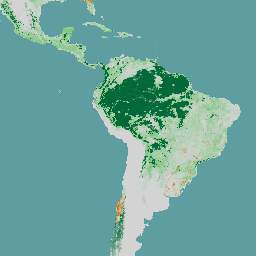
Forestry
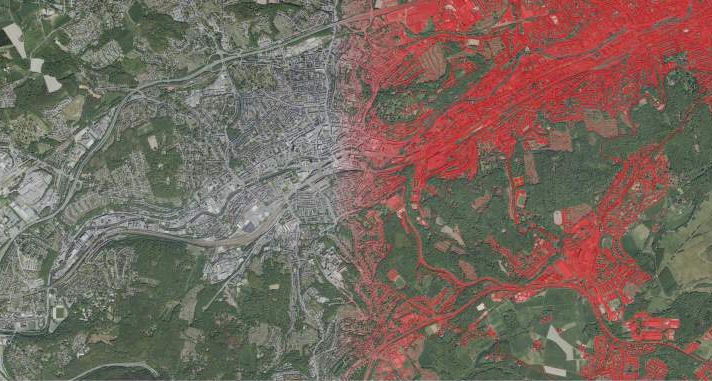
Urban
SINGULAR OBSERVATIONS (SNAPSHOTS/INVENTORIES
Capture static data at a single point in time
How many hectares in Savelugu, Ghana, were forested in January 2010?
How many open water bodies existed in Senegal’s arid desert zone during the 2020 rainy season?
What was the spatial extent of the 2023 Akosombo Dam spillage flood (click here for more information)?
Why Snapshots Matter
- Baseline data for policymaking, resource allocation, and historical records.
TIME SERIES (TREND DETECTION)
Compare changes over time
Did forest cover in Savelugu increase/decrease between 2010–2020? Where are deforestation or reforestation hotspots?
Compare open water bodies in Senegal’s arid zone during the 2020 rainy vs. dry seasons.
Was vegetation health in Burkina Faso in August 2015 above/below the 2014–2019 August average?
The Power of Time Series
- Detect trends (e.g., desertification, urbanization) and evaluate intervention impacts.
MULTI- SOURCE INTEGRATION
Combine data to understand causality
Multiple information from different sources can, and sometimes have to be combined to understand what is happening and why.
Why did forest cover decline in Savelugu? Combine satellite imagery (deforestation patterns), climate data (drought trends), and socioeconomic surveys (land-use changes).
Data Fusion for Deeper Insights
- Remote sensing + ground surveys + socio-economic data = holistic understanding.
“Always validate remote sensing data with ground truthing! For example, pair satellite counts of water bodies with field surveys to account for seasonal variations or sensor errors.”