

Vegetation indices
We can take advantage of the fact that different surfaces or land covers reflect electromagnetic radiation differently across the electromagnetic spectrum. This helps to distinguish land covers, e.g., water, forest, built-up area, grassland, or to qualify them on a scale, e.g., from green, healthy vegetation to senescent crops or dead plant material. Most of the time, this is done by combining information from several bands to indices. There are countless indices of which the most widely used is the Normalized Difference Vegetation Index (NDVI).
The Normalized Difference Vegetation Index (NDVI)
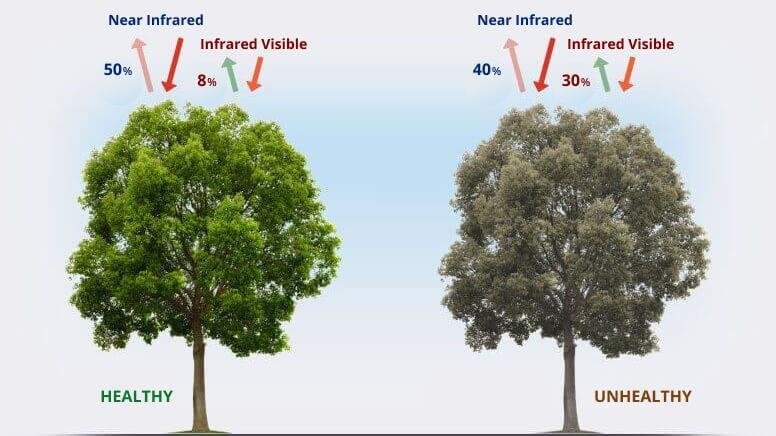
(Baldo 2022)
The Normalized Difference Vegetation Index (NDVI) is the most popular remote sensing-based vegetation index and is an indicator of green biomass. It works because vegetation reflects NIR and red differently according to its state
NDVI Calculation
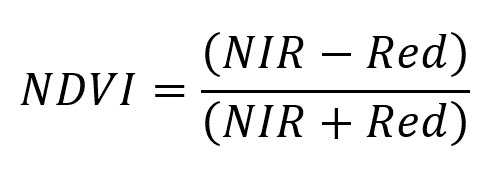
The NDVI is calculated as the normalized difference of the NIR and red bands to take advantage of this fact
NDVI interpretation
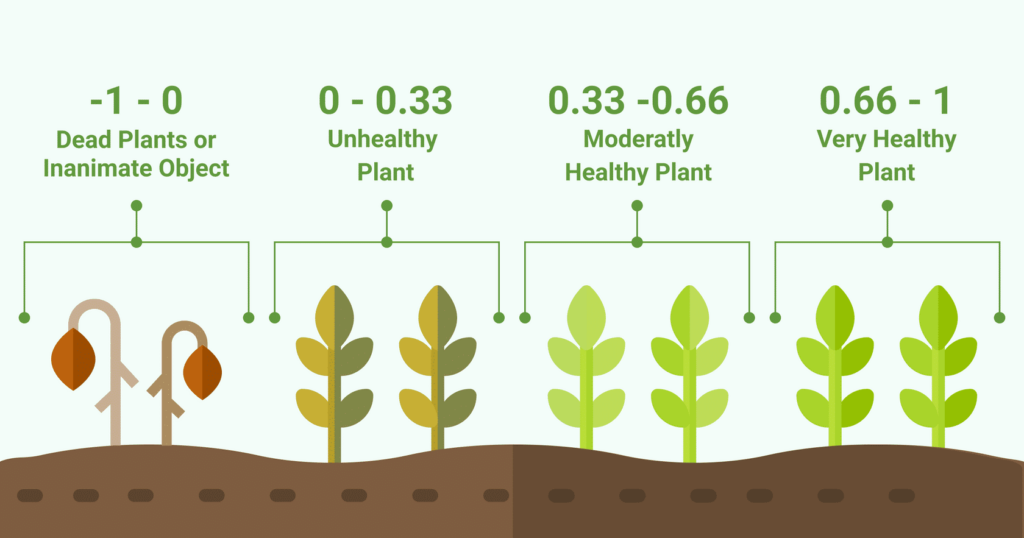
(NDVI interpretation. Source: https://eos.com/blog/ndvi-faq-all-you-need-to-know-about-ndvi/)
NDVI values range from -1 to 1, where low or negative values correspond to no or dead vegetation and high values correspond to healthy vegetation (Tucker, 1979). However, the thresholds here are only indicative. They depend on the individual plant and environment.
Want to know more?
For this lesson, a general understanding of the NDVI as a key vegetation index is sufficient. But if you would like to know more, find a more extensive explanation of how the NDVI and other spectral indices work here.
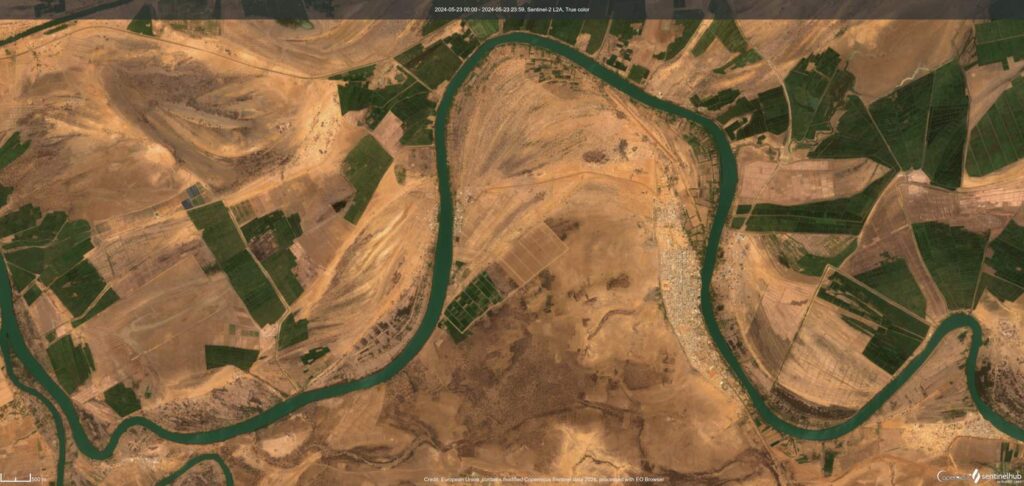
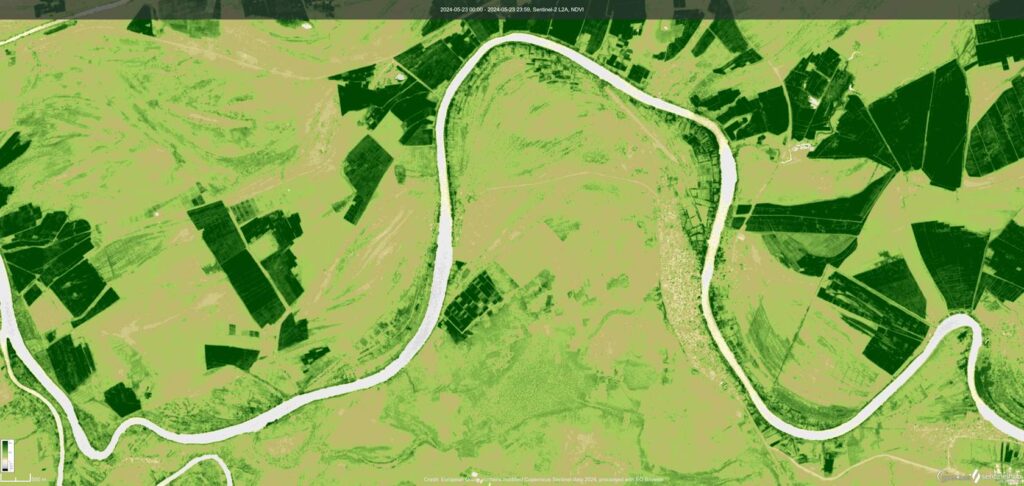
Compare the two images below to see how the NDVI (you will learn this in the next topic) represents different surfaces and objects: Bare soil, agricultural plots, the town of Podor in Senegal, water…