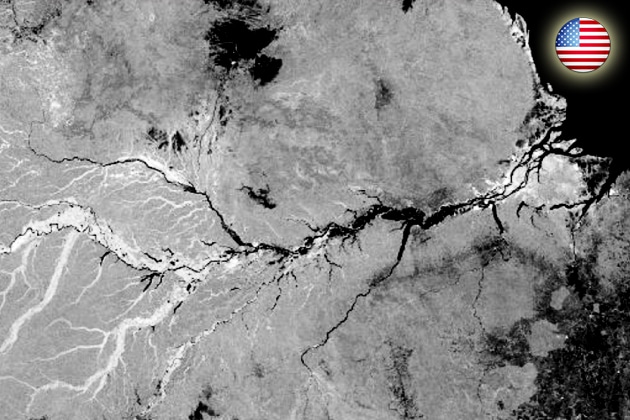
In these tutorials, you learn how to handle large-scale datasets in the Julia language using the EarthDataLab.jl package and how to map deforestations with the use of Recurrence Quantification Analysis of Sentinel-1 data.
Please be aware, that the EarthSystemDataLab package has been renamed to EarthDataLab.jl. Therefore, whenever you see ESDL in the tutorial you have to replace it with EarthDataLab.
In the first tutorial, we are going to build a data cube from a collection of preprocessed Sentinel-1 datasets. We are going to load TIF files into julia and are going to prepare them into an aligned data set to then save them as a chunked Zarr file for further analysis.
If you have any issues with the use of the packages that have been presented here feel free to open an issue or discussion at the EarthDataLab.jl package.
In the second tutorial, we are going to explore recurrence plots – a visualization technique for time series data. We are going to see the influence of different parameters on the construction of recurrence plots and are going to explain the use of Recurrence Quantification Analysis on Sentinel-1 data for the detection of deforestation in central Mexico.
The third tutorial is a short overview of the different features of the EarthDataLab.jl. We explore, how we can load data that is larger than RAM into the EarthDataLab.jl. You see how you can use the EarthDataLab.jl to apply functions along named axes and also how to apply them on moving windows in different dimensions. We are going to look at the Table interface to apply functions on polygon subsets of the data. We also see, how we can use python functions in the user-defined functions of EarthDataLab.jl.
We are also going to show how to enable the upscaling of the analysis using distributed or threaded computing in an easy way.





Responses