 Course Transcript
 Image Processing
Course Transcript  Course Transcript
 Beyond the Visible – Einführung in die hyperspektrale Fernerkundung
 Course Transcript
 Beyond the Visible – Imaging Spectroscopy for Soil Applications
 Course Transcript
 Beyond the Visible – EnMAP data access and image preprocessing techniques
 Course Transcript
 Beyond the Visible – Introduction to Hyperspectral Remote Sensing
 Course TranscriptPresentation
 Beyond the Visible – Imaging Spectroscopy for Agricultural Applications
 Tutorial
 Large-scale EO data handling
 Tutorial
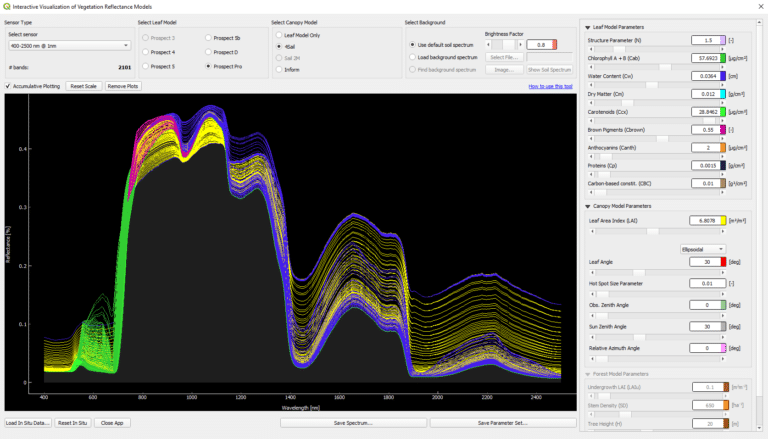
 Interactive Visualization of Vegetation Reflectance Models (IVVRM)
 Unit
Unit Retrieval approaches of vegetation traits from imaging spectroscopy data
 Unit
Unit Dimensionality reduction of imaging spectroscopy data
 Unit
Unit Principles of imaging spectroscopy
 Unit
Unit Land Cover Classification
 TalkTutorial
 SAR Processing and Data Analysis
 Talk
Talk Procesamiento y análisis de datos de SAR
 Tutorial
 SNAP – First Steps
 Unit
Unit Classification
 Unit
Unit Change Detection
 Unit
Unit Data fusion
 Unit
Unit Object based image analysis
 Unit
Unit Speckle filtering
 Unit
Unit Texture
 Unit
Unit