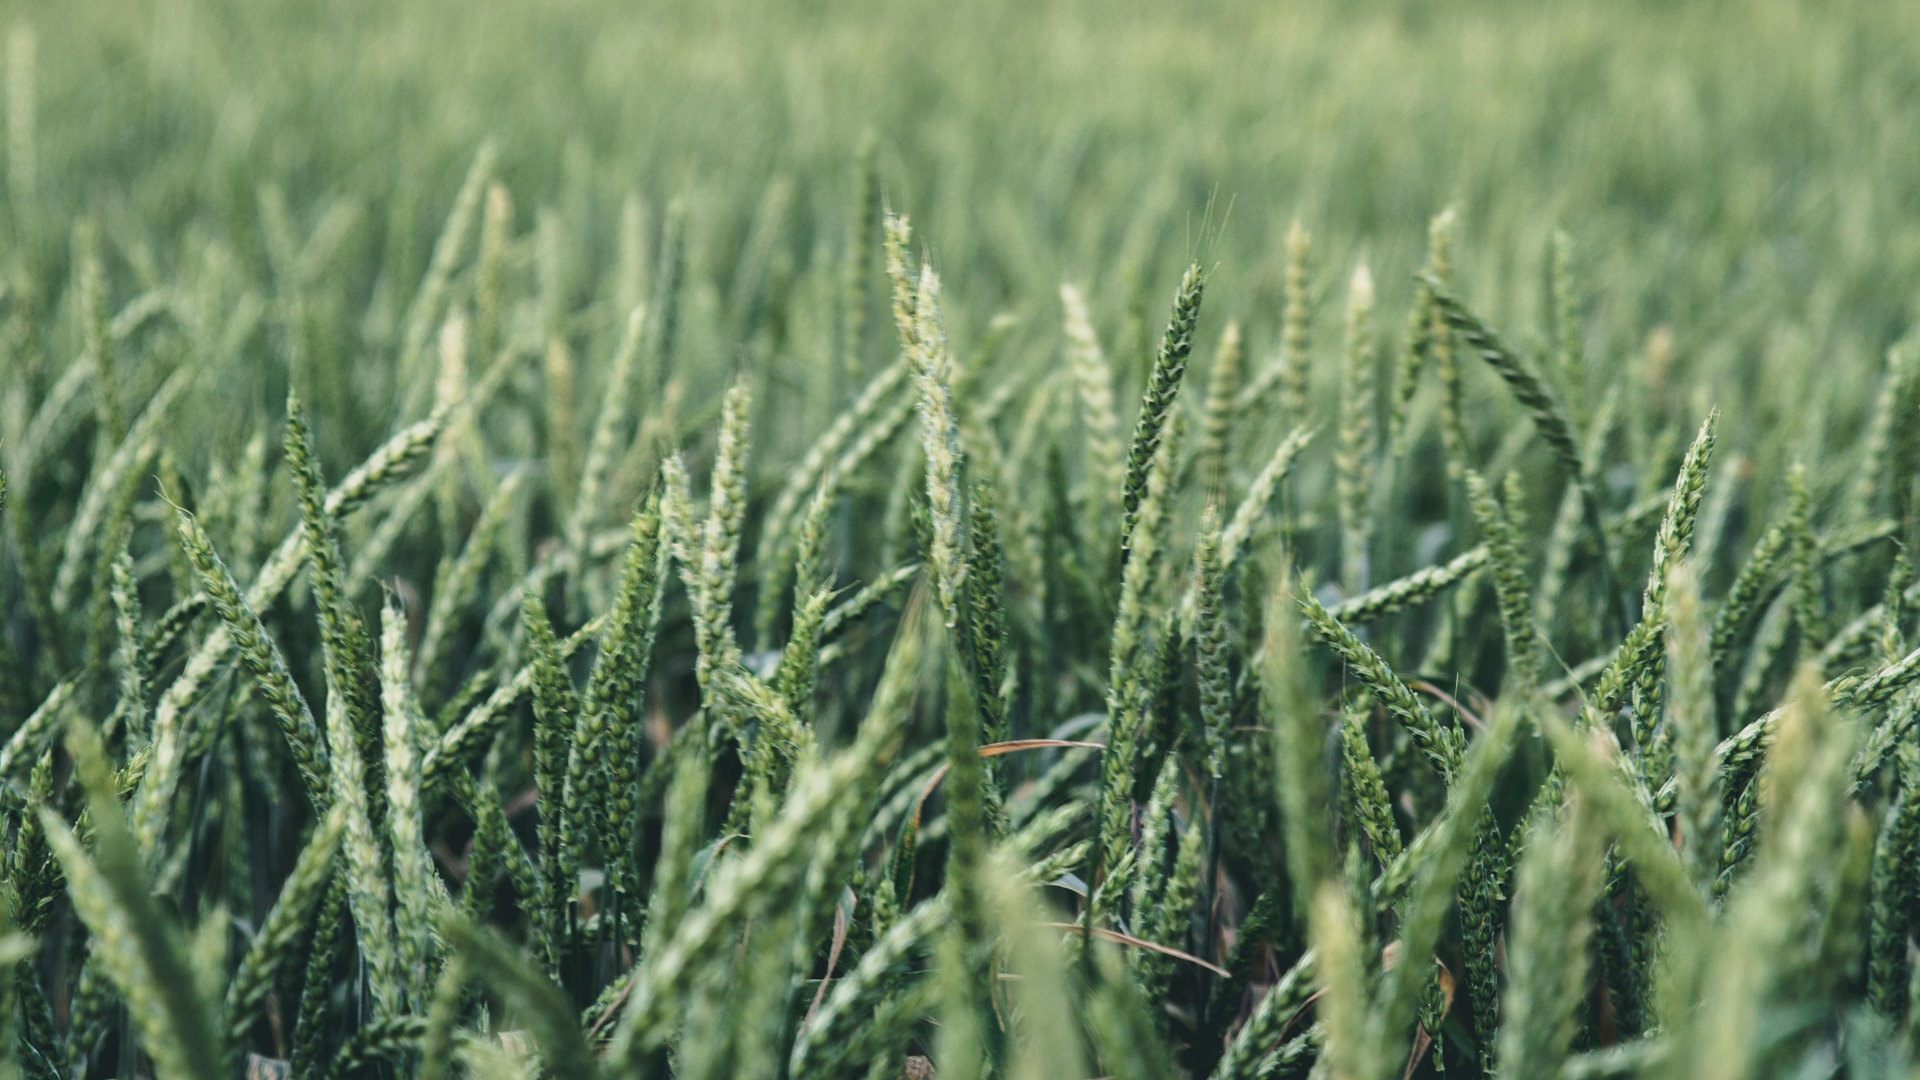
Accurate crop classification is essential for effective agricultural monitoring, food security management, and policymaking. Radar remote sensing has become a key tool in this context, thanks to its ability to collect data regardless of weather conditions or sunlight. Radar sensors operating at X-, C-, L-, and P-band frequencies provide complementary information about crop types and their growth stages. When used together, data from these different radar bands can significantly improve the accuracy of crop classification.
Listen to the Podcast
Radar Frequency Bands and Their Characteristics
Different radar frequencies interact in distinct ways with vegetation, depending on their wavelength:
- X-Band (8–12 GHz, ~2.5–3.75 cm wavelength): The short wavelength interacts mostly with the upper part of the crop canopy, such as leaves and small branches. It is sensitive to fine structural details and changes that happen during early crop growth stages.
- C-Band (4–8 GHz, ~3.75–7.5 cm wavelength): This frequency penetrates slightly deeper than X-band, capturing signals from both leaves and upper stems. The widely used Sentinel-1 satellites operate at C-band and provide regular, frequent data suitable for agricultural monitoring.
- L-Band (1–2 GHz, ~15–30 cm wavelength): With deeper penetration capabilities, L-band interacts with larger stems and branches, and can even capture signals from the soil surface under certain conditions. This makes it particularly useful for monitoring crop biomass and structural differences between crop types.
- P-Band (0.3–1 GHz, ~30–100 cm wavelength): The longest wavelength in this group allows deep penetration into vegetation and even the upper soil layers. P-band radar is highly sensitive to total biomass and root systems, making it ideal for distinguishing between crops with large biomass or deep roots.
Why Combine Different Radar Bands?
Each radar band provides unique information about crop structures. By combining them, we can achieve a more complete and accurate understanding of agricultural fields. X- and C-band data are good for detecting fine-scale canopy changes, while L- and P-band data reveal differences in biomass and deeper structural features.
For example, cereal crops like wheat and barley, which have early and distinct growth patterns, can be effectively monitored using X- and C-band radar. Crops with larger biomass, such as maize or sunflower, are better observed with L- and P-band systems. By integrating data from all four bands, we can improve crop discrimination and classification.
Methods to Exploit Multi-Frequency Radar Synergy
To take full advantage of multi-frequency radar data, researchers use a range of methods that combine and process data from different sources:
- Preprocessing and Calibration:
- All radar data must be radiometrically calibrated to ensure the backscatter values are accurate and comparable.
- Geometric corrections, including co-registration and terrain correction, ensure that data from different sensors align spatially, which is essential for combining datasets.
- Feature Extraction and Selection:
- From each frequency band, we can extract different features such as backscatter coefficients (σ⁰), polarimetric parameters (e.g., entropy, alpha angle), and texture features (e.g., from grey-level co-occurrence matrices or GLCMs).
- Time-series features showing how crops develop over time are also important.
- Feature selection techniques, like Recursive Feature Elimination (RFE) or Principal Component Analysis (PCA), help identify the most useful variables for classification.
- Data Fusion Techniques:
- Pixel-Level Fusion: Combines raw or preprocessed data from different radar bands at the pixel level.
- Feature-Level Fusion: Merges extracted features from each band into a combined feature space that feeds into the classifier.
- Decision-Level Fusion: Aggregates classification results from different frequency datasets using ensemble methods such as majority voting or boosting.
- Machine Learning and Deep Learning:
- Machine learning algorithms like Support Vector Machines (SVM), Random Forests (RF), and Gradient Boosting are frequently used to classify crops based on multi-frequency radar data.
- Deep learning methods, such as Convolutional Neural Networks (CNNs) and Recurrent Neural Networks (RNNs), are increasingly applied to handle complex spatial and temporal radar data, improving classification performance.
- Time-Series Analysis and Phenological Modeling:
- By analyzing radar backscatter data collected at different times in the growing season, we can track crop growth patterns.
- Time-series analysis techniques like BFAST (Breaks For Additive Season and Trend) or harmonic modeling allow us to characterize crop-specific phenology.
- Polarimetric Decomposition and Scattering Analysis:
- Fully polarimetric radar data (where available) can be analyzed using decomposition methods like Freeman-Durden or Cloude-Pottier. These methods help identify the dominant scattering mechanisms (surface, volume, double-bounce) associated with different crop types.
- Analyzing these mechanisms across different radar bands gives deeper insight into crop structure and condition.
Key Advantages of Using Multi-Frequency Radar Data
- Higher Classification Accuracy: The combination of multiple radar frequencies provides better discrimination between crop types than any single band alone.
- Better Temporal Monitoring: Different radar bands respond differently to crop development stages. Combining them provides a clearer picture over time.
- Increased Robustness: Using multiple frequencies reduces the risk of misclassification due to environmental factors like soil moisture variations or surface roughness.
- All-Weather Monitoring: Radar’s ability to collect data day and night, regardless of weather, ensures consistent monitoring throughout the growing season.
- Scalability: Multi-frequency radar methods work at various scales, from small field monitoring to large regional assessments. New missions like NISAR (L-band) and BIOMASS (P-band) will further enhance global crop monitoring when combined with C-band (Sentinel-1) and X-band (TerraSAR-X) data.
Conclusion
Integrating X-, C-, L-, and P-band radar satellite data provides a powerful approach for classifying crops in agricultural areas. By applying advanced processing and analysis methods, it is possible to gain accurate, timely, and reliable insights into crop types and their development. As more multi-frequency radar data become available, these techniques will play a growing role in supporting sustainable agriculture and food security worldwide.
Responses