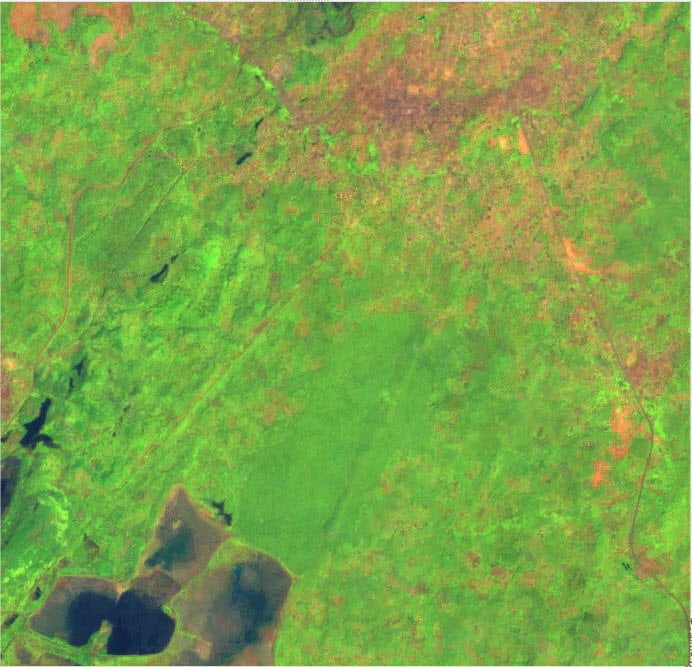
Locating Potential Land Grabs with Remote Sensing

Learning objectives of this topic
- Take a close look at certain tenure regimes and ownership patterns
- Make use of NDVI time series
- Do a temporal comparison and calculate mean values of your dataset
- Plot the time series and visualize your dataset
- Link irregularities to changes in landownership
The code used in this example can be found below the videos a well as by following this link:
https://code.earthengine.google.com/3a052ebb812865be63c4a62c35dc8930
Up next:
- Draw conclusions and estimations on certain tenure regimes or ownership patterns
- See an example of how to locate potential land grabs in Subsahara-Africa

By loading the video, you agree to YouTube’s privacy policy.
Learn more
Up next:
- How to use the NDVI time series
- Monitor changes in irrigation
- Conclude possible tenure change
By loading the video, you agree to YouTube’s privacy policy.
Learn more
Code used in the video
var Decrease = /* color: #ffc82d */ee.Geometry.Point([31.033888403992595, -17.394174311133924]),
    Increase = /* color: #00ffff */ee.Geometry.Point([31.007109229187908, -17.44453938264605]),
    VisParamNDVI = {"opacity":1,"bands":["NDVI"],"min":879.2,"max":6696.104347826087,"palette":["a31a14","cc7116","f9e6e6","8ee829","3a9d28"]},
    VisParamChange = {"opacity":1,"bands":["NDVI"],"min":-1531.7630434782604,"max":2844.0456521739134,"palette":["a31a14","cc7116","f9e6e6","8ee829","3a9d28"]};

// Select Zimbabwe as an roi to reduce datasets
var Zim = ee.FeatureCollection('USDOS/LSIB_SIMPLE/2017').filterMetadata('country_co', 'equals', 'ZI')
Map.addLayer(Zim)


// Call MODIS Vegetation indices as the basis for the showcase
var NDVI = ee.ImageCollection('MODIS/MOD13Q1').select('NDVI')
 print('Modis Collection:', NDVI );


// filter the collection to make use of two years at start and end
var ndvi2001 = NDVI
  .filterDate('2001-01-01', '2002-12-31');
print('Ndvi 2001:', ndvi2001 );

var ndvi2010 = NDVI
  .filterDate('2010-01-01', '2011-12-31');


// We want to create an NDVI mean for the first  and the second timestep and clip it to Zambia
var mean2001 = ndvi2001.mean().clip(Zim)
print('Mean 2001', mean2001)
var mean2010 = ndvi2010.mean().clip(Zim)


// Set visualization parameters


Map.addLayer(mean2001, VisParamNDVI)
Map.addLayer(mean2010, VisParamNDVI)

var difference = mean2010.subtract(mean2001)
Map.addLayer(difference, VisParamChange)


var plotIrrigation = ui.Chart.image.seriesByRegion(NDVI, Increase, ee.Reducer.mean(), 'NDVI', 500)
.setOptions({ title: 'NDVI Time Series INCREASE',  hAxis: {title: 'Date'},
vAxis: {title: 'NDVI'}
});
print(plotIrrigation);


var plotRainfed = ui.Chart.image.seriesByRegion(NDVI, Decrease, ee.Reducer.mean(), 'NDVI', 500)
.setOptions({ title: 'NDVI Time Series DECREASE',  hAxis: {title: 'Date'},
vAxis: {title: 'NDVI'}
});
print(plotRainfed);
Up next:
- Start your analysis in GEE
- Get detailed information about the code-workflow
- Calculate a temporal comparison
- Learn how to compare production, NDVI – values or productivity in the beginning to the one in the end of the time series
- Learn how to create subsets and work with them
- Calculate the means of your two datasets
By loading the video, you agree to YouTube’s privacy policy.
Learn more
Code used in the video
var Decrease = /* color: #ffc82d */ee.Geometry.Point([31.033888403992595, -17.394174311133924]),
    Increase = /* color: #00ffff */ee.Geometry.Point([31.007109229187908, -17.44453938264605]),
    VisParamNDVI = {"opacity":1,"bands":["NDVI"],"min":879.2,"max":6696.104347826087,"palette":["a31a14","cc7116","f9e6e6","8ee829","3a9d28"]},
    VisParamChange = {"opacity":1,"bands":["NDVI"],"min":-1531.7630434782604,"max":2844.0456521739134,"palette":["a31a14","cc7116","f9e6e6","8ee829","3a9d28"]};

// Select Zimbabwe as an roi to reduce datasets
var Zim = ee.FeatureCollection('USDOS/LSIB_SIMPLE/2017').filterMetadata('country_co', 'equals', 'ZI')
Map.addLayer(Zim)


// Call MODIS Vegetation indices as the basis for the showcase
var NDVI = ee.ImageCollection('MODIS/MOD13Q1').select('NDVI')
 print('Modis Collection:', NDVI );


// filter the collection to make use of two years at start and end
var ndvi2001 = NDVI
  .filterDate('2001-01-01', '2002-12-31');
print('Ndvi 2001:', ndvi2001 );

var ndvi2010 = NDVI
  .filterDate('2010-01-01', '2011-12-31');


// We want to create an NDVI mean for the first  and the second timestep and clip it to Zambia
var mean2001 = ndvi2001.mean().clip(Zim)
print('Mean 2001', mean2001)
var mean2010 = ndvi2010.mean().clip(Zim)


// Set visualization parameters


Map.addLayer(mean2001, VisParamNDVI)
Map.addLayer(mean2010, VisParamNDVI)

var difference = mean2010.subtract(mean2001)
Map.addLayer(difference, VisParamChange)


var plotIrrigation = ui.Chart.image.seriesByRegion(NDVI, Increase, ee.Reducer.mean(), 'NDVI', 500)
.setOptions({ title: 'NDVI Time Series INCREASE',  hAxis: {title: 'Date'},
vAxis: {title: 'NDVI'}
});
print(plotIrrigation);


var plotRainfed = ui.Chart.image.seriesByRegion(NDVI, Decrease, ee.Reducer.mean(), 'NDVI', 500)
.setOptions({ title: 'NDVI Time Series DECREASE',  hAxis: {title: 'Date'},
vAxis: {title: 'NDVI'}
});
print(plotRainfed);
Up next:
- Learn how to map the differences of the means
- Plot your whole Dataset and analyze it
- Spot irregularities by monitoring the NDVI and the agriculture ptoduction
- Link them to changes in land ownership
By loading the video, you agree to YouTube’s privacy policy.
Learn more
Code used in the video
var Decrease = /* color: #ffc82d */ee.Geometry.Point([31.033888403992595, -17.394174311133924]),
    Increase = /* color: #00ffff */ee.Geometry.Point([31.007109229187908, -17.44453938264605]),
    VisParamNDVI = {"opacity":1,"bands":["NDVI"],"min":879.2,"max":6696.104347826087,"palette":["a31a14","cc7116","f9e6e6","8ee829","3a9d28"]},
    VisParamChange = {"opacity":1,"bands":["NDVI"],"min":-1531.7630434782604,"max":2844.0456521739134,"palette":["a31a14","cc7116","f9e6e6","8ee829","3a9d28"]};

// Select Zimbabwe as an roi to reduce datasets
var Zim = ee.FeatureCollection('USDOS/LSIB_SIMPLE/2017').filterMetadata('country_co', 'equals', 'ZI')
Map.addLayer(Zim)


// Call MODIS Vegetation indices as the basis for the showcase
var NDVI = ee.ImageCollection('MODIS/MOD13Q1').select('NDVI')
 print('Modis Collection:', NDVI );


// filter the collection to make use of two years at start and end
var ndvi2001 = NDVI
  .filterDate('2001-01-01', '2002-12-31');
print('Ndvi 2001:', ndvi2001 );

var ndvi2010 = NDVI
  .filterDate('2010-01-01', '2011-12-31');


// We want to create an NDVI mean for the first  and the second timestep and clip it to Zambia
var mean2001 = ndvi2001.mean().clip(Zim)
print('Mean 2001', mean2001)
var mean2010 = ndvi2010.mean().clip(Zim)


// Set visualization parameters


Map.addLayer(mean2001, VisParamNDVI)
Map.addLayer(mean2010, VisParamNDVI)

var difference = mean2010.subtract(mean2001)
Map.addLayer(difference, VisParamChange)


var plotIrrigation = ui.Chart.image.seriesByRegion(NDVI, Increase, ee.Reducer.mean(), 'NDVI', 500)
.setOptions({ title: 'NDVI Time Series INCREASE',  hAxis: {title: 'Date'},
vAxis: {title: 'NDVI'}
});
print(plotIrrigation);


var plotRainfed = ui.Chart.image.seriesByRegion(NDVI, Decrease, ee.Reducer.mean(), 'NDVI', 500)
.setOptions({ title: 'NDVI Time Series DECREASE',  hAxis: {title: 'Date'},
vAxis: {title: 'NDVI'}
});
print(plotRainfed);
Sources & further reading
Tenure and SDGs Land Portal
https://landportal.org/book/sdgs
Data on indigenous and community lands
http://www.landmarkmap.org/
Data on protected areas
https://www.protectedplanet.net/en
Tenure and environmental protection
http://www.fao.org/americas/publicaciones-audio-video/forest-gov-by-indigenous/en/
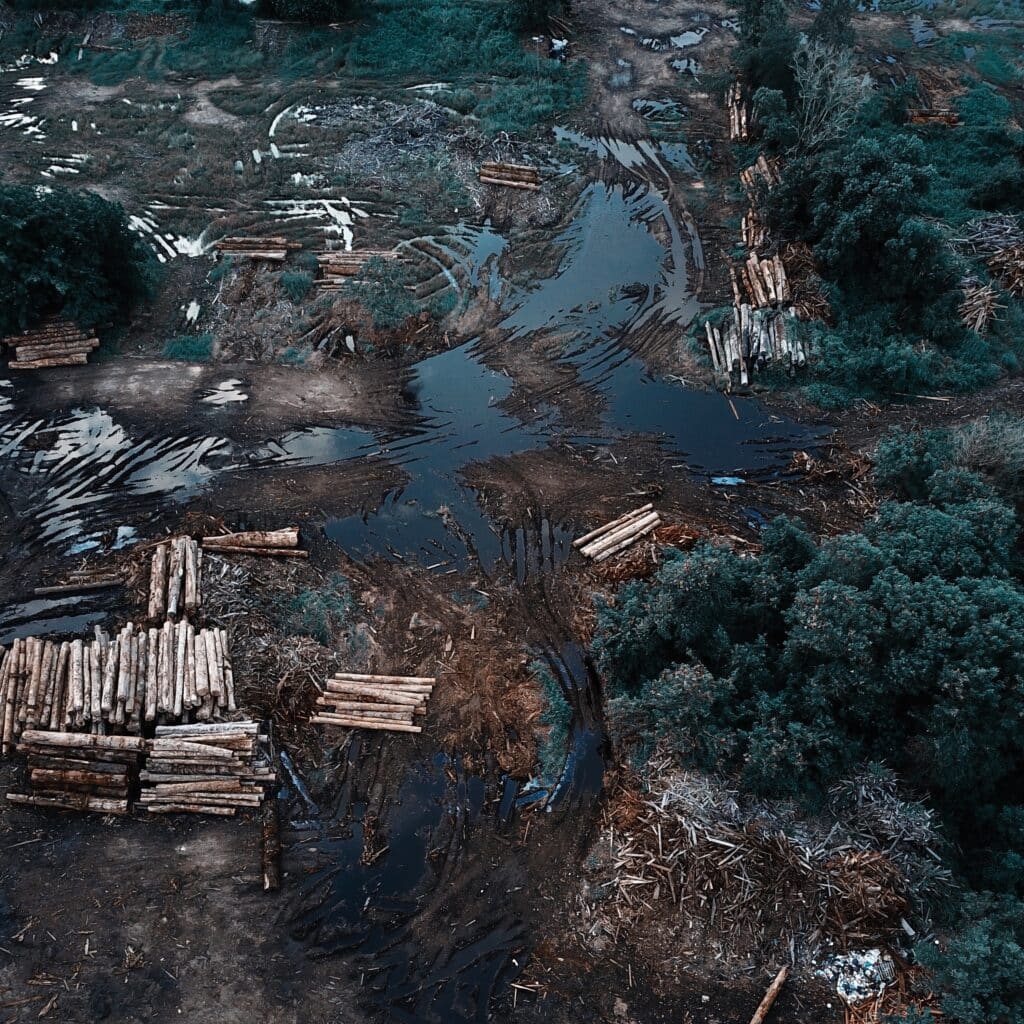
Remote sensing of deforestation
https://glad.earthengine.app/view/global-forest-change
Remote sensing of tenure, agricultural production and degradation
http://researchspace.csir.co.za/dspace/bitstream/handle/10204/1563/wessels_2004.pdf?sequence=3
Remote sensing to ensure land tenure security
https://its4land.com/
https://www.mdpi.com/journal/remotesensing/special_issues/Land_Administration
Responses