


Normalized Difference Vegetation Index (NDVI)
NDVI = (NIR – Red) / (NIR + Red)
The paper by Rouse et al. (1973), titled “Monitoring the Vernal Advancement and Retrogradation (Green Wave Effect) of Natural Vegetation”, introduced NDVI as a method to measure and monitor plant growth, vegetation cover, and biomass production using satellite data.
The NDVI provides information about the health and “greenness” of vegetation (greenness index).
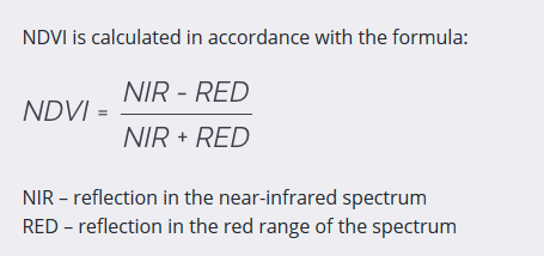
Value range and interpretation
NDVI values range from −1 to +1:
- < 0 → water, snow or clouds
- 0 to 0.2 → bare soil, built-up areas
- 0.2 to 0.5 → sparse or stressed vegetation
- > 0.5 → dense, healthy vegetation
Higher values indicate greater vegetation density and vigor. Note , that these thresholds are only guidelines, and their interpretation depends heavily on the season and the observed region.
What NDVI measures
NDVI provides information on:
- vegetation health (“greenness”)
- biomass and vegetation density
- photosynthetic activity
- general land surface condition
Applications
NDVI is widely used in:
- agricultural monitoring (crop health, drought stress)
- environmental monitoring (vegetation change, degradation)
- land use and land cover classification
- climate and ecosystem studies
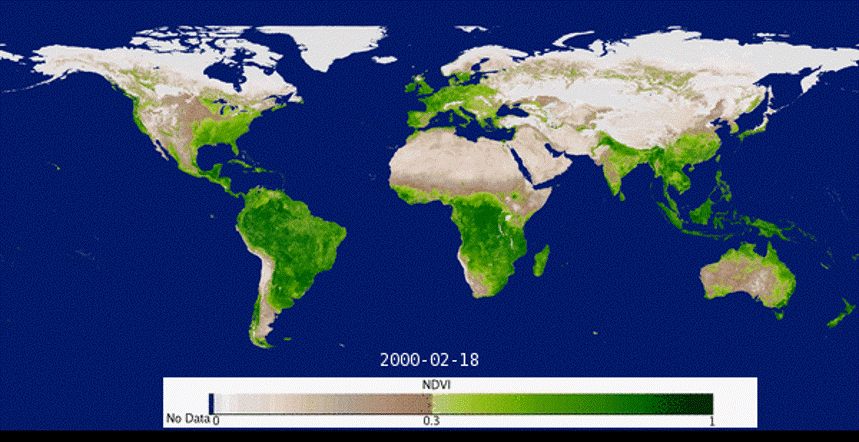
https://lpdaac.usgs.gov/resources/data-action/modis-global-vegetation-index-animation
Limitations
Advantages
- Easy to calculate
- Products are readily available and directly usable
- Effective for monitoring seasonal variations in vegetation
- Useful for assessing drought stress and estimating crop yields
Limitations
- Saturation in areas with dense vegetation
- Sensitive to atmospheric conditions and soil background
- Limited ability to distinguish between different vegetation types