

Classification Accuracy Assessment
In an accuracy assessment, the map is compared with validation data. Based on the sampling protocol for the collected validation data, a confusion or error matrix can be constructed. This confusion matrix is a cross-tabulation of the class labels allocated by map and validation data. Usually the map classes are represented in rows and the reference classes in columns.
The confusion matrix allows for the calculation of the following accuracy metrics (Congalton, 1991):
- Overall accuracy & Overall error
- Producer’s accuracy
- User’s accuracy
- Errors of omission
- Errors of commission
Table 1 gives an example of a confusion matrix for a classification with 3 classes (water, forest and urban). We will use this matrix to illustrate how to calculate the various accuracy metrics.
Table 1:
| Classified Reference | Water | Forest | Urban | Total |
| Water | 25 | 5 | 0 | 30 |
| Forest | 7 | 32 | 2 | 41 |
| Urban | 6 | 3 | 26 | 35 |
| Total | 38 | 40 | 28 | 106 |
Overall accuracy and overall error
Overall accuracy (OA) tells us the proportion of validation sites that were classified correctly. The diagonal of the matrix contains the correctly classified sites. To calculate the overall accuracy you sum up the number of correctly classified sites and divide it by the total number of reference sites.
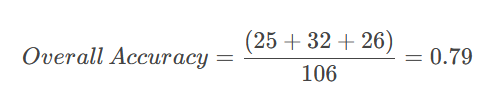
Overall error represents the proportion of validation sites that were classified incorrectly. This is thus the complement of the overall accuracy (accuracy + error = 100%). So you can calculate the overall error from the overall accuracy, or you add the number of incorrectly classified sites and divide it by the total number of reference sites.

In our example the overall accuracy is 78% and the overall error is 22%.
Producer’s accuracy
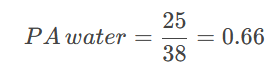
Producer’s accuracy (PA), also known as sensitivity (in statistics) and recall (in machine learning), is a measure for how often real features on the ground are correctly shown on the classified map. So it is the map accuracy from the point of view of the mapmaker (producer). It is calculated per class by dividing the number of correctly classified reference sites by the total number of reference sites for that class (= column totals).
User’s accuracy
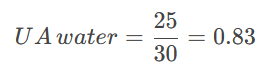
User’s accuracy (UA), also known (in statistics and machine learning) as precision, is a measure of how often the class on the map will actually be present on the ground. So it is the map accuracy from the point of view of the map user. It is calculated per class by dividing the number of correct classifications by the total number of classified sites for that class (= row totals).
Error of omission
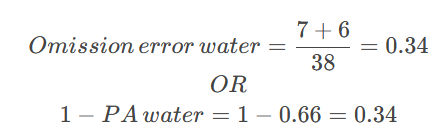
The error of omission is the proportion of reference sites that were left out (or omitted) from the correct class in the classified map. This is also sometimes referred to as a Type II error or false negative rate. The omission error is complementary to the producer’s accuracy, but can also be calculated for each class by dividing the incorrectly classified reference sites by the total number of reference sites for that class.
Error of commission
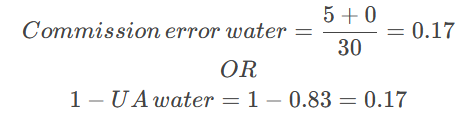
The error of commission is the proportion of classified sites that were assigned (or committed) to the incorrect class in the classified map. This is also sometimes referred to as a Type I error or false discovery rate. The commission error is complementary to the user’s accuracy, but can also be calculated for each class by dividing the incorrectly classified sites by the total number of classified sites for that class.