
Knowledge of various geospatial data types is essential for understanding, representing, and analyzing acquired data from various domains. Data carry not only spatial information but also measured values, derived data, or other targeted information. Based on their properties, they can be used for different purposes.
There are several common geospatial data types, each serving a specific purpose and having distinct characteristics.
Raster data
Raster data are represented as pixels and grid cells where every pixel has a value associated with it. Data stored in raster format can be discrete (representing distinct categories, eg. land cover types) or continuous (for example temperature or elevation).
Examples of raster data sources:
- Satellite data – Satellite imagery data are a common example of raster data. There are many types of data acquired by satellites and their processing. The temporal aspect of images is very important for continuous analysis.
- Aerial/drone orthophoto – Digital imagery obtained by aircrafts (e.g. drones) is usually high-resolution raster data usable for detailed analysis.
- DEM – Digital Elevation Models represent the surface of (usually) Earth and are essential for computations on a surface level.
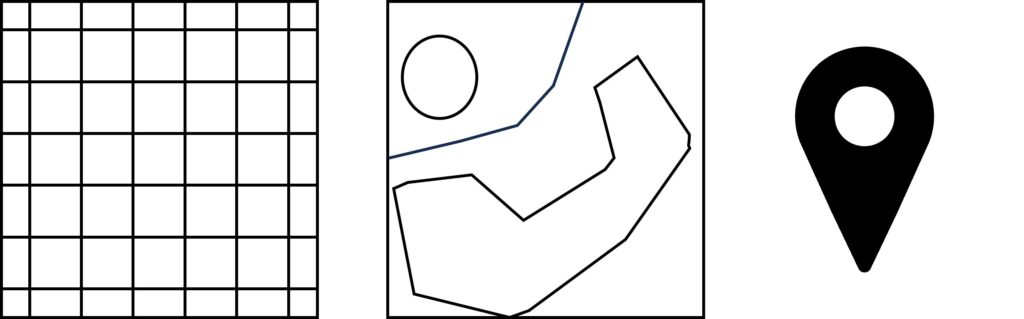
Vector data
Vector data are a fundamental type of geospatial data. Vector data represents spatial features using 3 basic classes – points, lines, and polygons and the attributes associated with them. With vector data, it is possible to capture and analyze complex spatial patterns and attributes with great accuracy, providing valuable insights into spatial phenomena and supporting decision-making processes. Vector data are commonly used in addition to raster data to highlight or accompany trends and results.
Examples of vector data:
- Building footprints (Polygons) – Building footprints are usually represented as polygons and capture the perimeter of buildings on the Earth’s surface. These footprints can vary in complexity from simple rectangles for standard buildings to more intricate shapes that outline the exact contours of complex structures.
- Street networks – Street networks are depicted as lines, representing the pathways through which vehicles and pedestrians can move. Each line segment can indicate a portion of a street, alley, highway, or path, connecting intersections and endpoints to map out the entire transportation infrastructure of an area.
- Points of interest – Points of Interest (POIs) are examples of point vector data. They represent specific locations that hold importance or interest within a geographic area or use case. These can include landmarks, businesses, public facilities, and natural features, among others.
In-situ data
In-situ data are data collected directly at the place of interest and are connected to a special location. There are many reasons why these data are important and one of them is an enhancement of data collected by other means eg. weather measurements from satellites enhanced with local air quality measurements. There are countless examples of what can be measured, two common examples are:
- Air temperature
- Soil quality
Datacubes
Datacube refers to a multidimensional representation of data that incorporates spatial and temporal dimensions. It is a concept used to organize and analyze large volumes of geospatial information in a structured and efficient manner. Datacubes are combining the data types discussed above into one data structure. More about datacubes is in Lesson 1.2