
By loading the video, you agree to YouTube’s privacy policy.
Learn more
The concept of representing multidimensional data as data cubes fits ideally to the challenges of representing satellite data that is usually dealing with multiple dimensions such as: lat, lon, time, bands, etc. In the video below it becomes very clear what the strengths of data cubes in EO are.
Data Cubes Explained Source : ESA
An example data cube
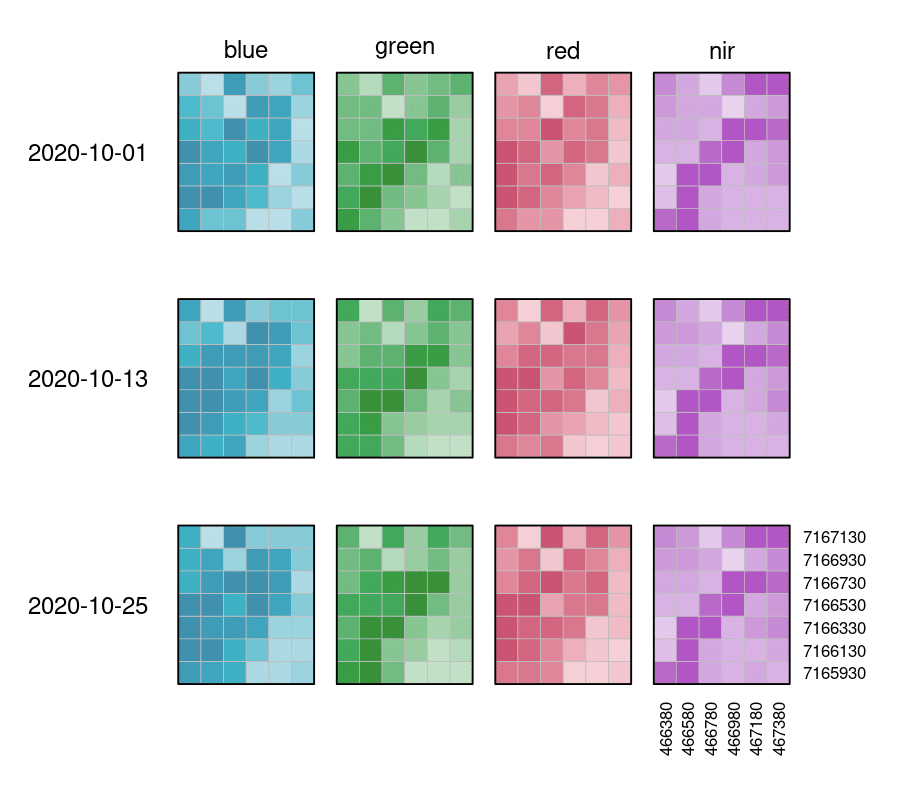
Data can be represented as datacubes in EO, which are multi-dimensional arrays with additional information about their dimensionality. Datacubes can provide a nice and tidy interface for spatiotemporal data as well as for the operations you may want to execute on them. As they are arrays, it might be easiest to look at raster data as an example, even though datacubes can hold vector data as well. Our example data however consists of a 6×7 raster with 4 bands [blue, green, red, near-infrared] and 3 timesteps [2020-10-01, 2020-10-13, 2020-10-25], displayed here in an orderly, timeseries-like manner:
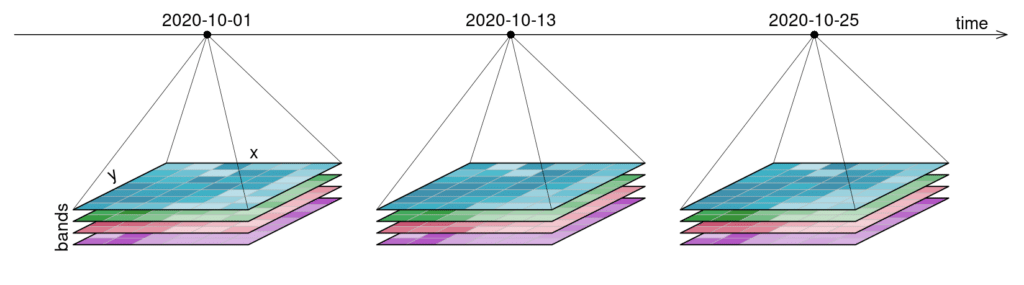
It is important to understand that datacubes are designed to make things easier for us, and are not literally a cube, meaning that the above plot is just as good a representation as any other. That is why we can switch the dimensions around and display them in whatever way we want, including the view below: