
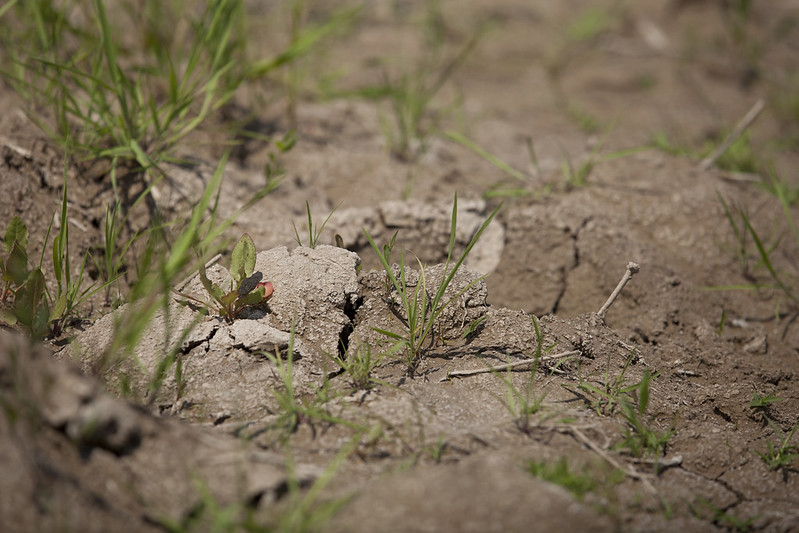
SAOCOM L-band data are well suited for different agricultural applications. A selection of these applications are introduced below.
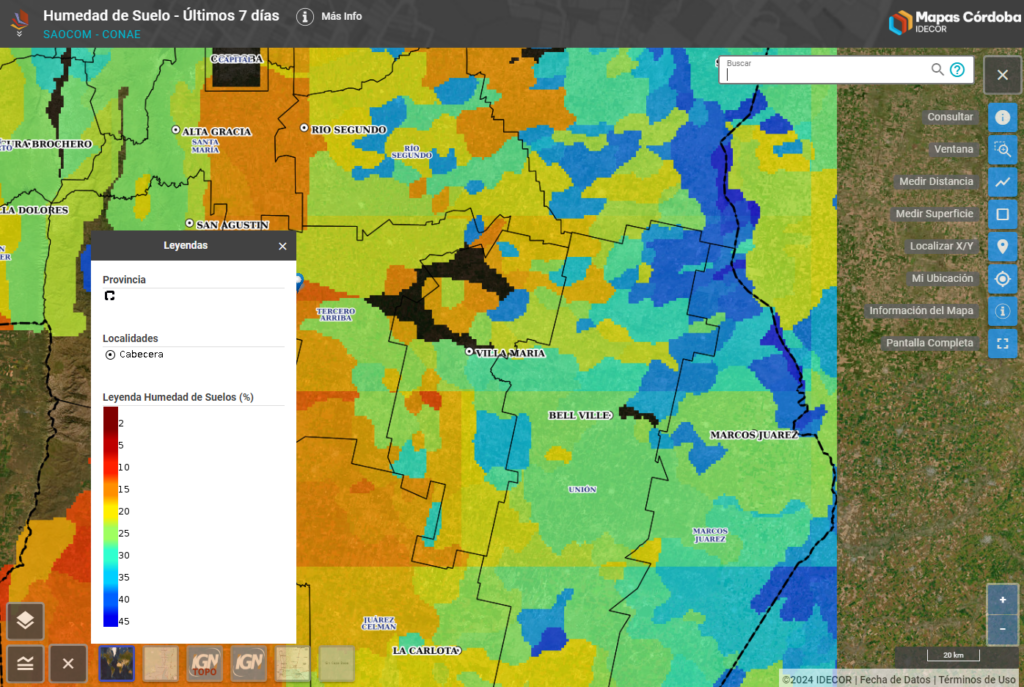
IDECOR Soil Moisture Maps
IDECOR stands for “Infraestructura de Datos Espaciales de la Provincia de Córdoba” (Spatial Data Infrastructure of the Province of Córdoba). It is an initiative in the Province of Córdoba, Argentina, aimed at providing access to geographic data in a free and open manner.
Based on SAOCOM-1 L-band SAR data, IDECOR creates maps of soil moisture estimates for the top 50 cm depth for the past 7 days prior to the date of inquiry. There are different layers of soil moisture estimates. The layer “Integrated soil moisture profile – Day 1” corresponds to the estimation from the day before the inquiry, while the layers “Integrated soil moisture profile Days 2, 3, 4, 5, 6, and 7” correspond to the estimations of the 7 days prior to the date of inquiry, consecutively.
In addition to the moisture maps, the user has cadastral data and soil-related data (coverage, land use capability, and productivity index) available to enhance the utilization of the available resources.
You can access the viewer here: https://mapascordoba.gob.ar/viewer/mapa/87
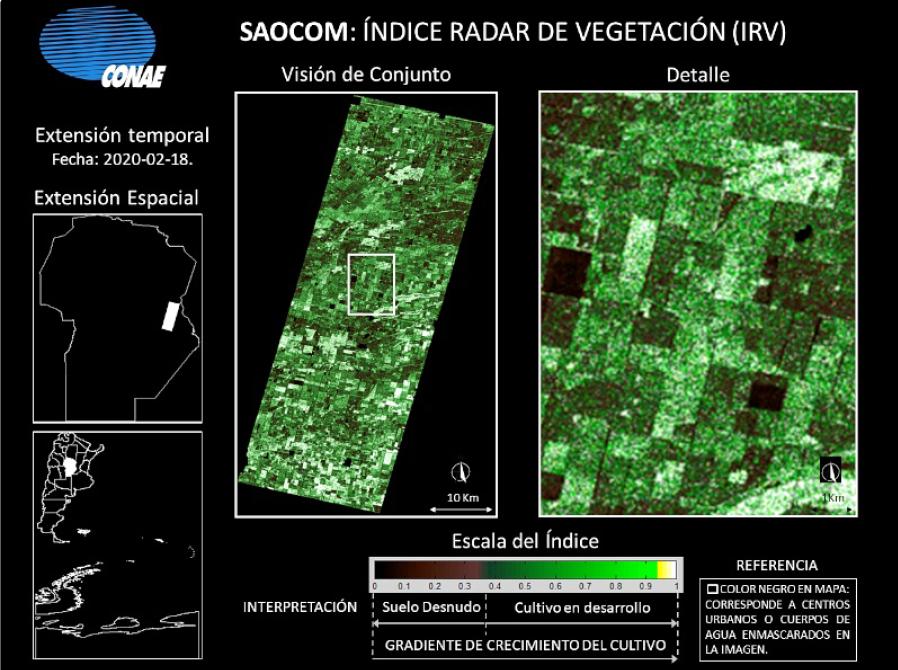
Radar Vegetation Index to monitor plant growth
The Radar Vegetatio Index (RVI) or Índice Radar de Vegetación (IRV) provided by CONAE detects plant growth, similar to the NDVI obtained by optical sensors, and allows tracking in any weather conditions, as the micro waves from SAOCOM satellites penetrate clouds and obtain the necessary data.
Advanced Products
Decision Support System
COMAE experts developed a Decison Support System to provide probable crop yield scenarios based on the sowing date, knowledge of rainfall and soil humidity measured by SAOCOM satellites. Moisture Maps of the Soil Profile (integrated) up to a depth of 50 cm is available in the CONAE Geoportal.
Fusarium prognosis system
This will provide support for the appropiate application of chemical products to control diseases in crops, in particular for the Fusarium Disease in wheat (see also here: Wikipedia), whose mycotoxins not only damage the crop, but can also affect human health. The Fusarium Probability Map, in relation to the critical periods of the cereal, alerts about a possible attack of the disease to minimize losses with the application of fungicides. These maps are also available in the CONAE Geoportal.
Risk management due to hydrological emergencies
This is hydrological model, which uses the SAOCOM soil moisture maps as an important input parameter. If the output flow exceeds a certain reference level, an alert will be issued. With this information, producers can have a flood warning system. Based on this product, periodic reports are delivered to the Directorate of Hydrological Information and Alert Systems of the National Water Institute (INA).