Mapping changes over time
Combining satellite images of multiple time steps is a frequently used method to derive change maps and seasonal characteristics. It is not only used with radar images but also in optical remote sensing.
This topic explains the basic concepts and gives some application examples. Time series will be of particular interest in the agriculture tutorial of this course.

By loading the video, you agree to YouTube’s privacy policy.
Learn more
Southern California INSAR Time Series

NASA – Jet Propulsion Laboratory

By loading the video, you agree to YouTube’s privacy policy.
Learn more
This animation depicts variations in surface elevation resulting from the discharge and recharge of groundwater basins in Southern California. These seasonal fluctuations, which range between -5 and +5 centimeters (-2 to +2 inches), result from the pumping of groundwater during the dry season (Summer/Fall) and recharge of the basins during the wet season (Winter/Spring). Reductions in elevation, resulting from extraction of groundwater, are shown in orange, while increases in elevation, resulting from the recharge of the basins, are shown in blue.
In addition to the annual fluctuations, a net decrease is seen in elevation over the 6+ years of this study due to compaction of the basin sediments over time. This compaction results in a loss of storage capacity in the groundwater basins.
The spatial and temporal patterns of ground deformation were measured with radar interferometry, generating more than 42 interferograms from synthetic aperture radar (SAR) acquired by ESA’s ERS-1 and ERS-2 satellites. An interferogram is a map of the relative changes in the distance between the satellite and surface of the earth, expressed as differences in phase. The interferometric technique measures ground deformation with a precision of 2.8 centimeters (~ 1 inch).
SAR data and analysis courtesy of Paul Lundgren of the Jet Propulsion Laboratory. For more information regarding this animation, please contact Paul Lundgren or Vincent Realmuto, Jet Propulsion Laboratory.
Reference: Lanari, R., P. Lundgren, M. Manzo, and F. Casu (2004), Satellite radar interferometry time series analysis of surface deformation for Los Angeles, California, Geophys. Res. Lett., 31, L23613, doi:10.1029/2004GL021294 .

NASA – Jet Propulsion Laboratory
Mount Etna InSAR Time Series Animation

NASA – Jet Propulsion Laboratory

By loading the video, you agree to YouTube’s privacy policy.
Learn more
This animation depicts a time-series of ground deformation at Mount Etna Volcano between 1992 and 2001. The deformation results from changes in the volume of a shallow chamber centered approximately 5 km (3 miles) below sea level. The accumulation of magma in this chamber results in the inflation, or expansion, of the volcano, while the release of magma from the chamber results in deflation or contraction.
The spatial and temporal patterns of ground deformation was measured with radar interferometry, generating more than 200 interferograms from synthetic aperture radar (SAR) acquired by ESA’s ERS-1 and ERS-2 satellites. An interferogram is a map of the relative changes in the distance between the satellite and surface of the earth, expressed as differences in phase. The interferometric technique measures ground deformation with a precision of 2.8 cm (~1 inch).
The red and yellow colors within the sliding time bar indicate significant levels of eruption activity, with red indicating strong activity and yellow signifying moderate activity. The animation begins with a large flank eruption in progress, causing deflation of the volcano. This eruption, which ended in March 30, 1993, was followed by a 2-year cycle of inflation and a resumption of summit activity in late 1995. Eruption activity progressively increased in magnitude through the late 1990’s and culminated with large flank eruptions in 2001 and 2002-2003. InSAR data processing and interpretation of results courtesy of Paul Lundgren, Jet Propulsion Laboratory.
Reference: Lundgren, P., and others (2004), Gravity and magma induced spreading of Mount Etna volcano revealed by satellite radar interferometry, Geophys. Res. Lett., 31, L04602, doi:10.1029/2003GL018736 .
For more information regarding this animation, please contact Paul Lundgren or Vincent Realmuto, Jet Propulsion Laboratory.

NASA – Jet Propulsion Laboratory
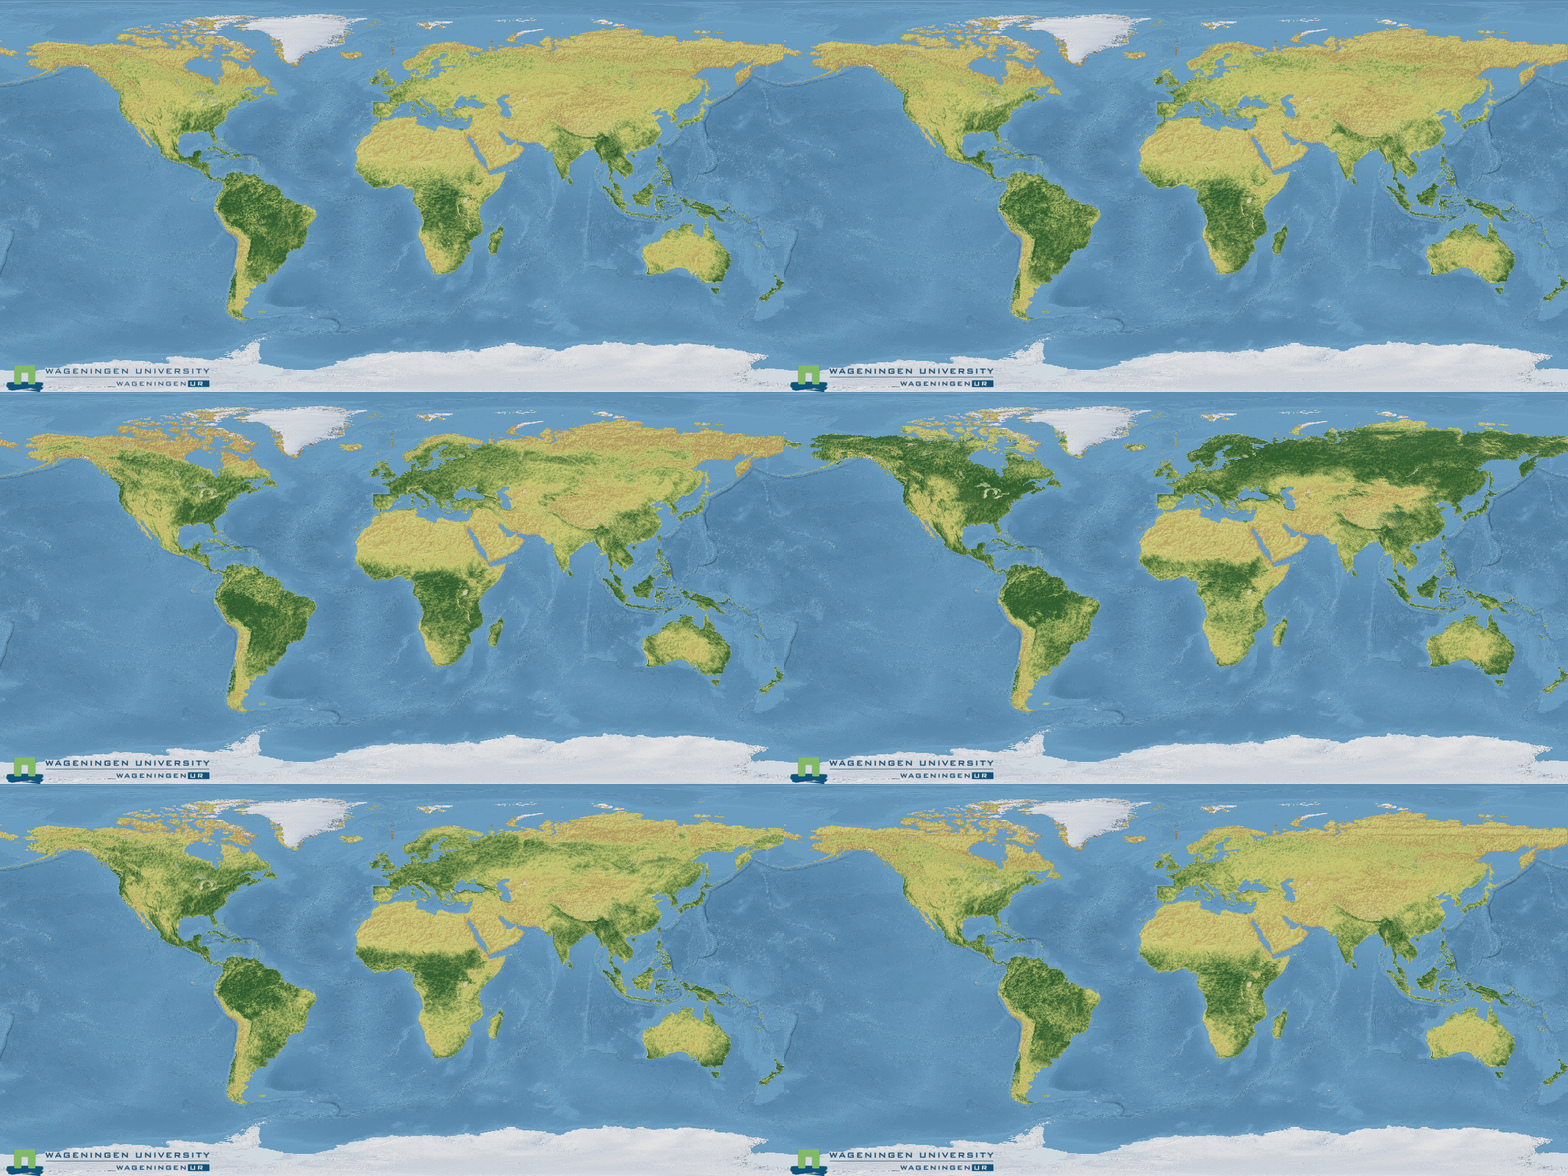
Monthly Global NDVI time series
This animation shows an example of a time series from optical satellites. It depicts a global map of the monthly averaged Normalized Difference Vegetation Index (NDVI). It represents a nice example of the capability of time series to map seasonal patterns and changes.
See the website of Wageningen University & Research for more information.


