
The advantage of multi-temporal data

By loading the video, you agree to YouTube’s privacy policy.
Learn more
With the opening of the Landsat archive to every interested user back in 2008, a new era of remote sensing began. More and more data sets became freely available, allowing the analysis of larger areas but also analysis with higher temporal coverage at smaller or no cost. In recent years, the amount of data sets which can be obtained freely has drastically increased. The graphic below gives you an idea of why time series analysis becomes more and more important. It visualizes the yearly amount of data in petabyte (PB) produced by different sensors. And while some other sensors such as the Advanced Very High-Resolution Radiometer (AVHRR), Moderate Resolution Imaging Spectroradiometer (MODIS) or Landsat date far more back than the Sentinels, the high temporal and spatial coverage of ESA’s satellites have drastically improved the capabilities of (for now) short-term time series analysis.

The significantly increased number of data sets improved and multiplied the number of methods used to perform various kinds of trend analysis. Higher possible repetition rates over certain areas of our land surface allow a more detailed look into the characteristics of aspects like spectral and spatial patterns over time. Typically, remote sensing time series can be divided into three components: 1) long-term directional trend, 2) seasonal characteristics and 3) unsystematic, short-term fluctuations (Kuenzer et al. 2015). These components can be used to create short-term to long-term time series, depending on the type of application in focus.
What kind of variables can be derived?
In time series analysis, we can derive a large variety of parameters to analyze trends over time. Open the tabs below to browse through a selection of tools, which you can use to assess the full potential of time series information.
Spectral bands
Naturally, the analysis of single bands is the simplest way of analyzing trends across multiple time steps. The video below visualizes the change in different spectral bands over time. You will see that these variables already contain lots of useful information that can be used to classify pixels.
Ratios
Ratios of remote sensing bands are commonly used in time series analysis. Especially, normalized ratios tend to be more robust against outliers and noise effects. They can be interpreted with relative ease and can provide One popular example is the Normalized Vegetation Difference Index (NDVI), which is calculated as given below:
\frac{NIR-RED}{NIR+RED}Biophysical parameters
When observing land surfaces globally, biophysical parameters are important indicators, displaying the gradual changes of land over time. In contrast to the ratios, described before, the variables are calculated using fixed values or constants, which have a physical meaning towards the signal we are measuring using remote sensing techniques. In the picture of rapidly increasing amounts of forests being permanently lost due to deforestation, wildfires or biome shifts, parameters such as leaf area index (LAI), fraction of photosynthetic active radiation (fPAR) and % canopy cover are often used time series indicators to analyze in remote sensing.
Multi-temporal statistics
The observation of the variables explained above proved to be a valuable source of information for decades, and still is. However, with the start of data acquisition of Sentinel-1 and Sentinel-2, we now do not only have optical time series data being acquired in even higher spatial and temporal resolution (in combination with Landsat) but also active microwave data (or radar). Due to the strong increase in repetition rates over a given point on the Earth’s surface, we can now have a closer look into intra-annual trends. This can be done by analyzing not single values but to group these into yearly or even seasonly statistics such as minimums, maximums, quantiles, standard deviations, break points, anomalies or weighted means. Using these parameters, you can for example locate areas that were the driest or which changed most significantly in the range of a season or a year.
Time series analysis methods
Change Detection
The simplest way of analyzing the change of land surfaces over time is to perform change detections between two or more dates. For this purpose a given date is used as the ‘status quo’ of a land feature. Based on this, we can then compare imagery to analyze them based on features that were explained above. See the image below to see an example of the use of remote sensing for change detection analysis of forest cover.
By loading the video, you agree to YouTube’s privacy policy.
Learn more
Typically, this process is referred to as ‘post-classification’. This means that we 1) perform a single date analysis on different data sets and 2) compare the results which represent classifications of the identical methodology to the initial state. Here, we can e.g., identify the count for image cells that changed over time (to see the frequency of change), the of state shift a land surface has performed or generally stable areas over time.
Trend analysis
For dense time series data we can also analyze the different type of information that is stored in the signal, collectively described as “trend”. As described earlier, there are different features we can discriminate from the original time series signal. In the image below you can see these distinctive variable which, as a whole, compile the initial signal. The comprehensive plot visualizes the outcome of the Breaks For Additive Season and Trend (BFAST) algorithm.
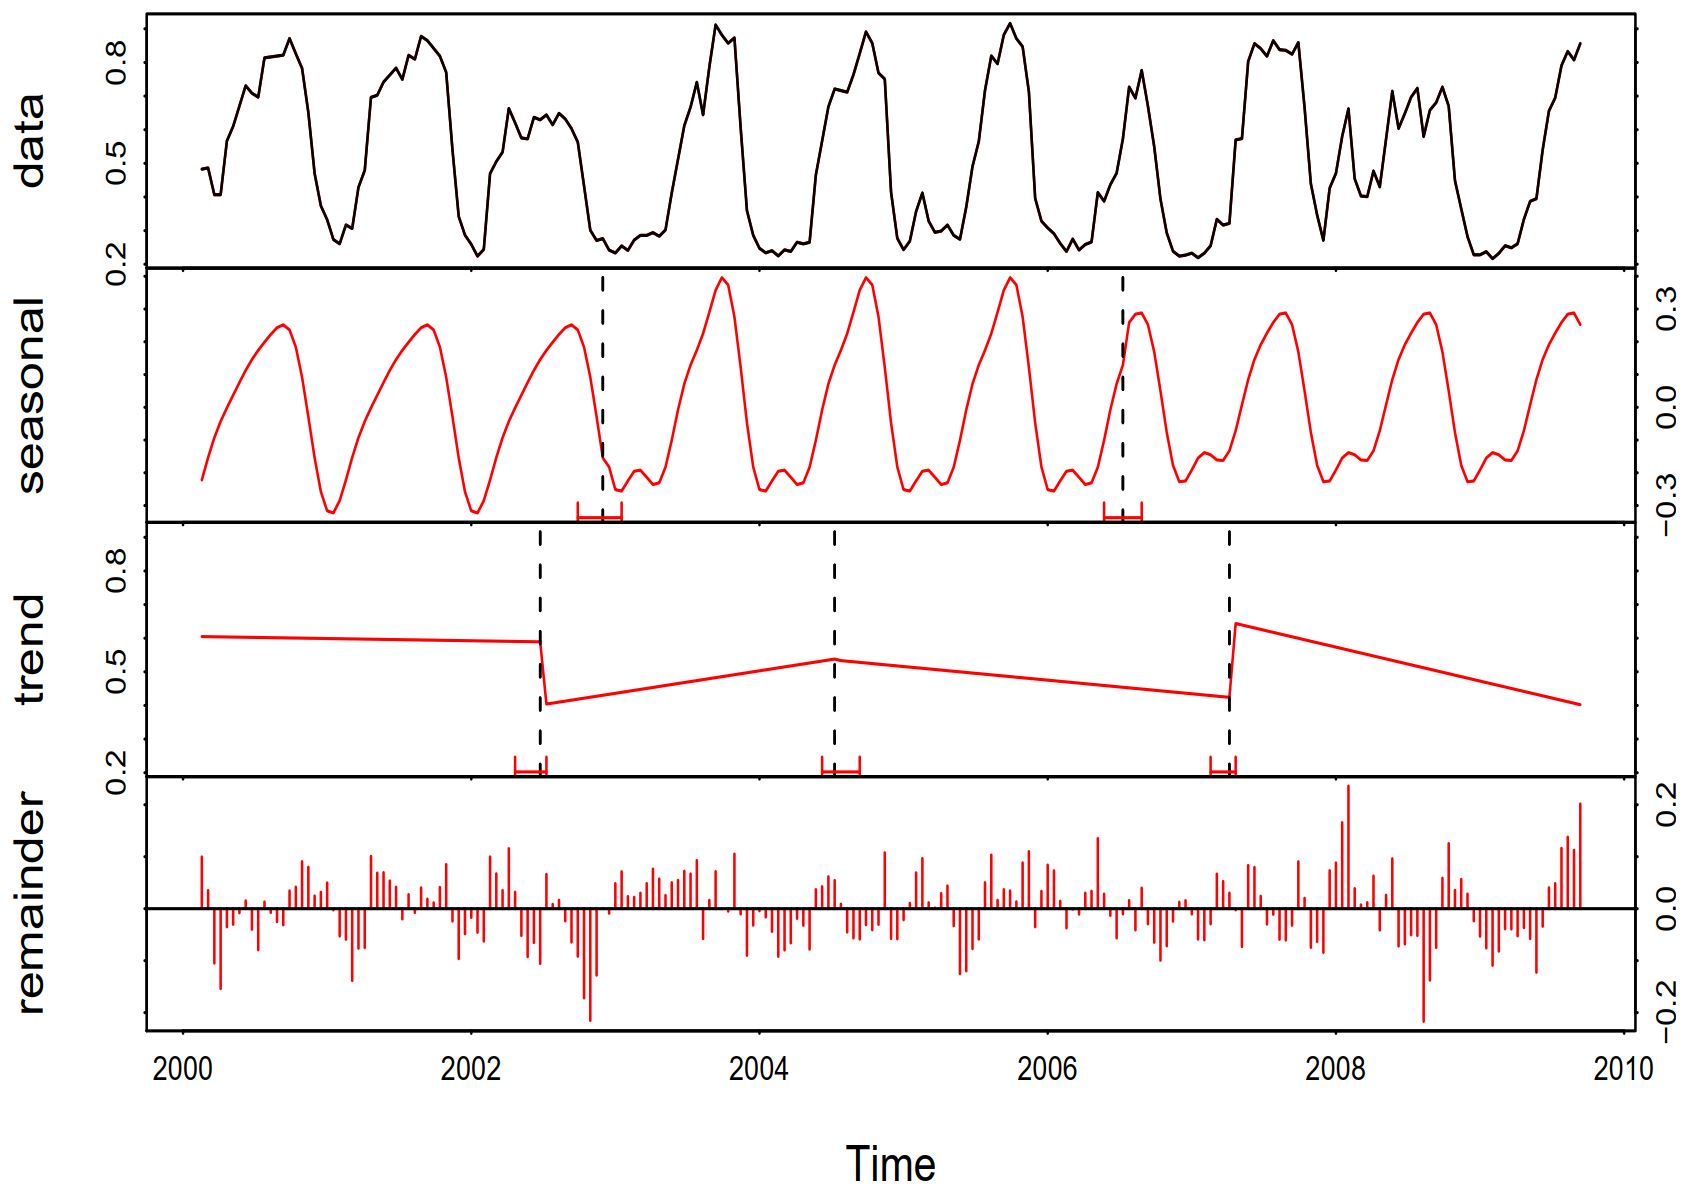
BFAST is a tool available for the programming software R, was developed by Jan Verbesselt and his team and allows the detection and characterization of changes in time series data by decomposition of the signal. Looking at the plot above, you easily identify so-called ‘breakpoints’, which mark the change in short-/long-term trends. When using this technique for e.g. deforestation mapping, the BFAST (or similar) trend detection algorithm identifies points in time, which mark the change of the state of a given pixel. Such a change could for example mean that forest loss occurred (caused by anthropogenic or natural causes) or that land has been afforested with young trees.
By loading the video, you agree to YouTube’s privacy policy.
Learn more
Sources & further reading
Kuenzer, C., Dech, S. & Wagner, W. (2015). Remote Sensing Time Series Revealing Land Surface Dynamics: Status Quo and the Pathway Ahead. In: Kuenzer, C., Dech, S. & Wagner, W. (Ed.). Remote Sensing Time Series (pp. 1-24). Switzerland: Springer Intl. Publishing.
Soille, P., Burger, A., De Marchi, D., Kempeneers, P., Rodriguez, D., Syrris, V. & Vasilev, V. (2018). A versatile data-intensive computing platform for information retrieval from big geospatial data. In: Future Generation Computer Systems 81, pp. 30-40. https://doi.org/10.1016/j.future.2017.11.007.
Verbesselt, J., Hyndman, R., Zeileis, A., Culvenor, D. (2010). Phenological Change Detection while Accounting for Abrupt and Gradual Trends in Satellite Image Time Series. Remote Sensing of Environment 114, 12, 2970-2980. https://10.1016/j.rse.2010.08.003.
Verbesselt, J. <http://bfast.r-forge.r-project.org/>.