
Wavelength & Frequency
In this topic you will learn about two core features influencing microwave imaging, wavelength and frequency. Both are closely related and have great impact on what the satellites we are using are showing us. Now let’s get started…

By loading the video, you agree to YouTube’s privacy policy.
Learn more
Overview of the Radar bands

Source: European Space Agency (ESA, 2013)
Popular Radar Bands
Ka-Band
(26 – 40 GHz | 7.5 – 11.54 mm)
Communications satellites, uplink in either the 27.5 GHz and 31 GHz bands, and high-resolution, close-range targeting radars on military aircraft.
Ku-Band
(12 – 18 GHz | 1.67 – 2.5 cm)
Used for satellite communications. In Europe, Ku-band downlink ranges from 10.7 GHz to 12.75 GHz for direct broadcast satellite services, such as Astra.
X-Band
(8 – 12 GHz | 2.5 – 3.75 cm)
Used in radar applications including continuous-wave, pulsed, single-polarisation, dual- polarisation, synthetic aperture radar and phased arrays. X-band radar frequency sub-bands are used in civil, military and government institutions for weather monitoring, air traffic control, maritime vessel traffic control, defence tracking and vehicle speed detection for law enforcement.
C-Band
(4 – 8 GHz | 3.75 – 7.5 cm)
Apart from Radar Remote Sensing primarily used for satellite communications, for full-time satellite TV networks or raw satellite feeds. Commonly used in areas that are subject to tropical rainfall, since it is less susceptible to rain fade than Ku band (the original Telstar satellite had a transponder operating in this band, used to relay the first live transatlantic TV signal in 1962).
S-Band
(2 – 4 GHz | 7.5 – 15 cm)
Weather radar, surface ship radar, and some communications satellites, especially those of NASA for communication with ISS and Space Shuttle. In May 2009, Inmarsat and Solaris mobile (a joint venture between Eutelsat and Astra) were awarded each a 2×15 MHz portion of the S-band by the European Commission.
L-Band
(0.5 – 1.5 GHz | 20 – 60 cm)
Global Positioning System (GPS) carriers and also satellite mobile phones, such as Iridium; Inmarsat providing communications at sea, land and air; WorldSpace satellite radio.
P-Band
(0.25 – 0.5 GHz | 60 – 120 cm)
Future Satellite missions will also utilize the long P-Band frequency band with wavelengths up to 1.2 meters.
How are wavelength and frequency related?
Wavelength and frequency of microwave radiation have a close relationship and are consequently depending on each other. Electromagnetic waves travel at the speed of light (299,792 km/s). As shown above, there are many different types of waves with varying frequencies and wavelengths.
They are all related by one important equation: Any electromagnetic wave’s frequency (f) multiplied by its wavelength (λ) equals the speed of light (c).
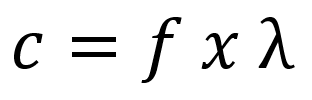
Following, this relationship can be used to figure out the wavelength or frequency of any microwave if the other variable is known.

Interactions between wavelength and radar targets
As wavelengths differ across SAR sensors, their interaction with targets on our Earth’s surface varies equally. Depending on the wavelength, some objects scatter the incoming radiation while others may be penetrated and thus not properly ‘sensed’ by the instrument. Thus, the sheer object size decides whether an object does interact with the presented microwave radiation or not (relative to the wavelength). The knowledge of the interaction between the geometry of an object and the wavelength is therefore crucial for any application of radar data.
The figure below visualizes what SAR systems utilizing different wavelengths actually see if they look at the same tree (this example is an Austrian pine). It can be seen how the different parts of the tree are sensed by varying wavelengths.
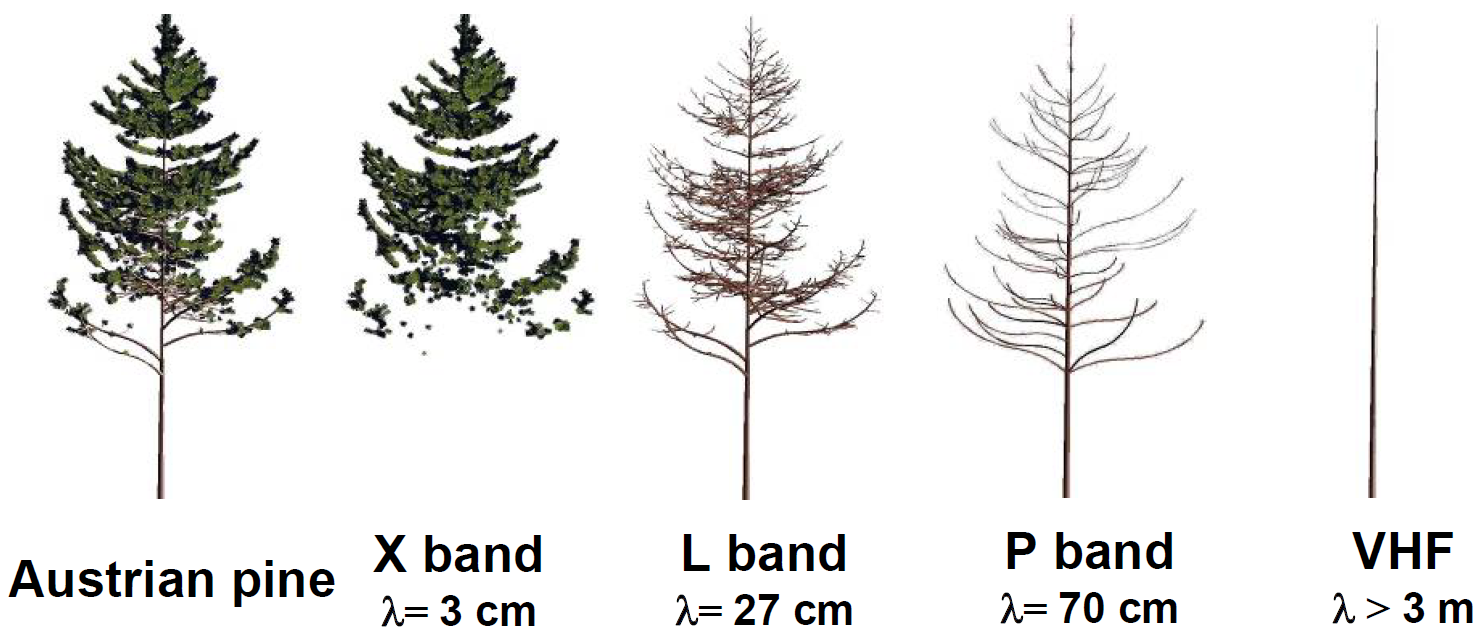
Source: Le Toan (2007)
Source: Schumann & Moller (2015)
Polarisation
What is the polarisation?
Synthetic aperture radar (SAR) systems are active instruments, meaning that they have their own source of illumination. Not only does this allow data acquisition during night time and relative independence from atmospheric conditions, but also having full control over the transmitted and received signal with regards to the so-called ‘polarisation’.
By loading the video, you agree to YouTube’s privacy policy.
Learn more
The polarisation describes the orientation of the electric field vector in the plane that is orthogonal to the wave propagation direction. Commonly, there are three types of instrument specifications describing the polarisation:
Single-pol
Transmits horizontally or vertically polarized waveforms and receives it in the same direction. The naming convention would be HH (Horizontal, Horizontal) or VV (Vertical, Vertical).
Example:
ERS-1, Radarsat-1
Dual-pol
Transmits either horizontally or vertically polarized waveforms and measures signals in both polarization directions in receive. The polarisations acquired by this instrument would then be called HH and HV (Horizontal, Vertical).
Example:
Sentinel-1, ALOS-1
Quad-pol
These instruments are also referred to as ‘full-pol’ systems and would change between transmitting horizontallly and vertically polarized waveforms to then receive both H and V. Consequently, the received data would result in HH, HV, VH, VV.
Example:
ALOS-2, Radarsat-2
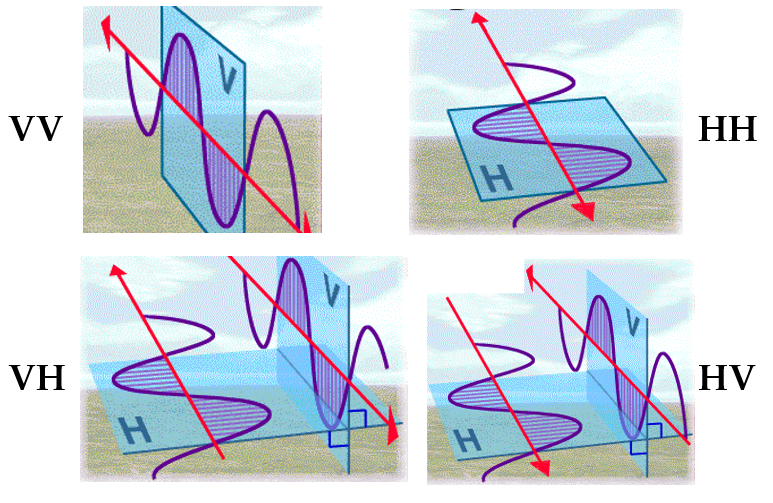
Source: European Space Agency (ESA, 2014)
Types of polarisation
How an electromagnetic wave is polarised also depends on the orientation of the electric field or the plane of the propagating signal’s oscillation. In SAR applications, most of the sensors are linearly polarised. Alternatively, other forms of polarisation can exist but are less often used in remote sensing. Types of polarisation are visualized and explained below.
Linear polarisation
This is the most common polarisation technique for spaceborne radar systems. Here, the electric field of light is confined to a single plane along the direction of propagation as given on the right.
Circular polarisation
In this case, the electric field of light consists of two linear components that are perpendicular to each other, equal in amplitude, but have a phase difference of π/2 (phase shift of 90 degrees). The resulting tip of the electric field rotates in a circle around the direction of propagation and, depending on the rotation direction, is called left- or right-hand circularly polarised wave.

Elliptic polarisation
This polarisation type is also more of a conceptual idea in microwave remote sensing applications. Here, the electric field of light forms an elliptic shape. This results from the combination of two linear components with differing amplitudes and/or a phase difference that is not π/2. This is the most general description of polarized light, and circular as well as linear polarised light can be viewed as special cases of elliptically polarised light.
Source: Images are taken from edmundoptics.com
Interactions between polarisation and scatter targets
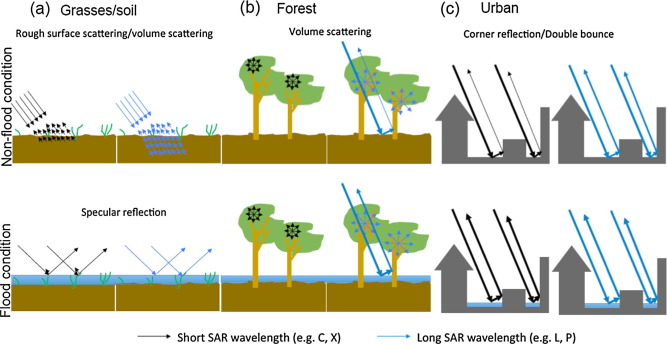
Knowing how your instrument is polarising transmitted waves is an important key to understand how these interact with objects on the ground leading to differences in radar brightness for different polarisation channels. Earlier in this course you learned about the three main types of scattering: surface, volume and double-bounce scattering. When we look at how these scattering types contribute to certain polarimetric channels (e.g. HH or HV), we see that there are distinct differences in the relative strength of backscatter.
The figures below visualise how polarisations contribute to different polarimetric scatterers. This rule of thumb could be used to carry out first classifications and to gain better understanding of how certain scatterers are distributed over our SAR scene.
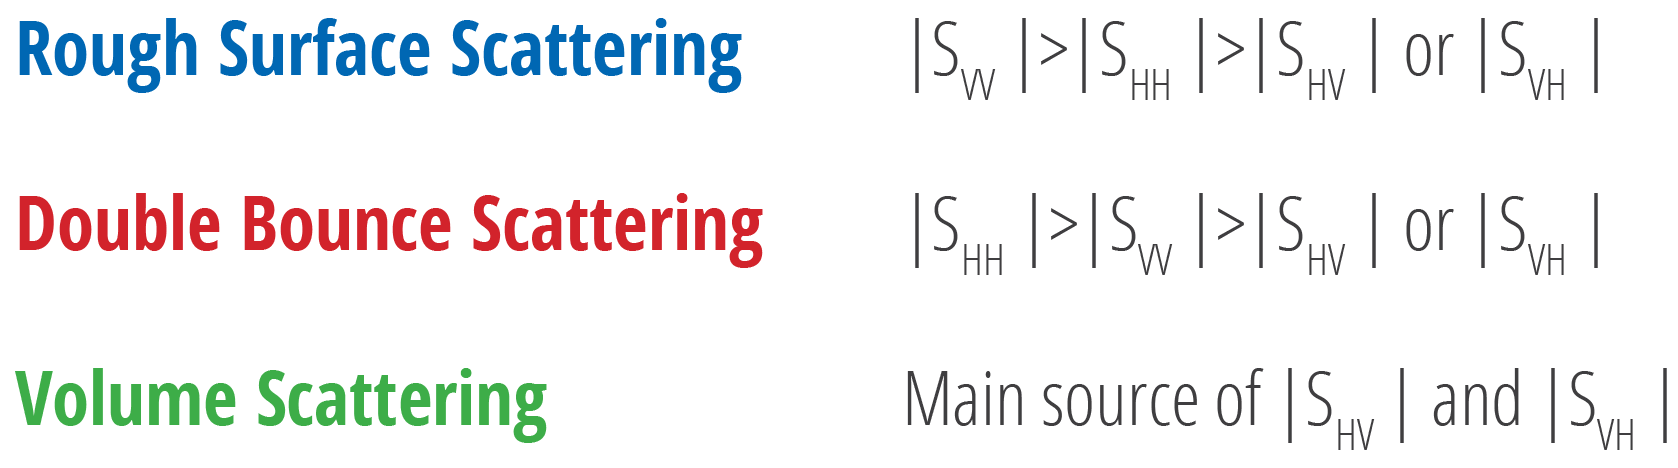

Source: Flores-Anderson et al. (2018)
Sensor Geometry
Imaging geometry?
Radar systems have a very unique way of making measurements. Microwave pulses are sent out towards the Earth’s surface and the echoes are recorded back at the sensor. In this topic we will learn why this is the case and how this geometry is described.
By loading the video, you agree to YouTube’s privacy policy.
Learn more
Why does the radar need to look sideways?
A radar system primarily makes a measurement of time. The antenna sends out pulsed microwaves and detects the time it takes for the echoes to return from the target scene back to the antenna. If a radar would transmit this pulse straight down towards in nadir direction on a flat surface, the distance of all the targets on this surface to the radar antenna would be almost identical. Therefore, the echoes would mostly return simultaneously, and no differentiation of the signals could be made.
By implementing a side-looking geometry and transmitting pulses obliquely, the radar system is able to resolve distinct targets on the ground by detecting a different time delay for each of the targets, since the time delay is then approximately correlated with distance along the ground (in the range direction).
The nomenclature
Before processing and interpreting radar data, it is important to understand the vocabulary that is used to describe the imaging process. This knowledge will be crucial to understand what you see in a radar image and how the microwaves interact with the surface
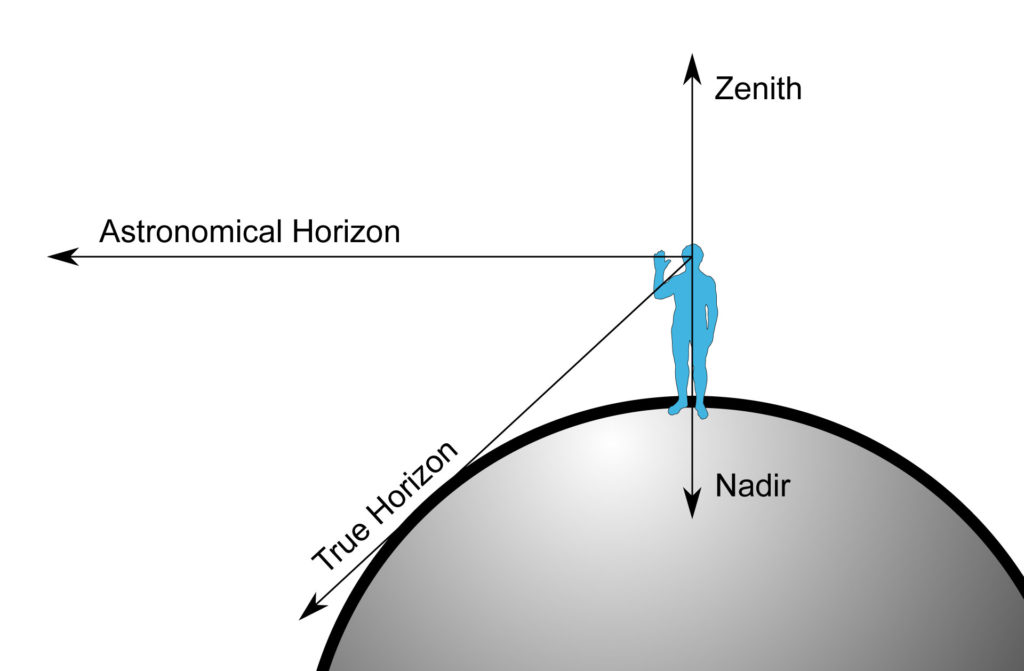
Nadir
Nadir describes the direction below a particular location. In the context of remote sensing, it refers to the point directly below the satellite/aircraft. To be more precise, it can be defined as the local vertical direction pointing toward the force of gravity at a particular location. The opposite direction to the nadir is the zenith.
Swath
The term ‘swath’ has its roots in farming. It describes the width of a scythe. This analogy has been transferred into remote sensing. In this context, the swath width describes the area (width) on the ground that is covered by the sensor instrument of satellites or aircrafts.
In the context of radar, the swath describes the strip of the Earth’s surface that is illuminated by the radar. The swath has a longitudinal extent, which corresponds to the movement of the sensor in azimuth direction. The swath width is the respective perpendicular component in range direction.
Azimuth
In the context of radar remote sensing, azimuth describes the flight direction or direction of travel of the satellite/aircraft. It can also be referred to as the line of flight.
In an image, azimuth is also known as along-track direction, since it is the relative along-track position of an object within the antenna’s field of view following the radar’s line of flight.
Range
The range direction is the distance between the radar and each illuminated target. It is the dimension of an image perpendicular to the line of flight (azimuth). In radar remote sensing, we differentiate between slant range and ground range. Slant range is the distance from the radar towards each target and measured perpendicular to the line of flight. Ground range is the same distance, projected using a geometrical transformation onto a reference surface such as a map.

Incidence Angle
The incidence angle is the angle defined by the incident radar beam and the vertical (normal) to the intercepting surface. In general, reflectivity from distributed scatterers decreases with increasing incidence angle. The incidence angle changes across the radar image swath; it increases from near range to far range.
A change in incidence angle often affects the radar backscattering behaviour of a surface. In the case of satellite radar imagery, the change of incidence angle for flat terrain across the imaging swath tends to be rather small, usually on the order of several degrees. In the case of an inclined surface, the local incidence angle is defined as the angle between the incident radar beam and a line that is normal to that surface.
System Noise
Systematic noise in the backscatter signal
By loading the video, you agree to YouTube’s privacy policy.
Learn more
Every antenna produces a certain amount of noise. Therefore, even if all of the emitted energy is being scattered away from the sensor, the received energy will never equal to zero. This amount of energy coming from the system itself is often referred to as the ‘noise floor’, ‘noise equivalent’ or ‘noise equivalent sigma zero’ (NESZ) and usually described in decibel (dB).
Typically, the NESZ for most spaceborne SAR systems varies between -20 and -30 dB. As an example, the widely used Sentinel-1 C-Band satellite from ESA operates with a noise floor between -24 and -22 dB. For some applications (e.g. water signal returns) the backscatter intensities can be less than the NESZ, making a reliable analysis difficult since the expected radar echo is lower than the NESZ.

Source: Modified after Meng et al. (2017)
The overall aim in the construction of any new satellite is therefore to keep the level of noise as small as possible, to allow the interpretation of even the smallest backscatter values, that we received from the Earth’s surface.
How strong the systematic noise floor is, can be determined through the documentation that comes with each satellite sensor from the respective space agency/company.
When do we care about system noise?
In general, systematic noise can create problems when we are looking at really low backscatter values (e.g. cross-pol channel values in interferometric or polarimetric applications). In such cases, it can become difficult to define the actual underlying radar cross section. When the signal is low enough to relate to the system noise, this can has an impact on both amplitude and phase of the radar return. Because of this, you should always consider the noise floor in relation to the possibly very low backscatter signal as you might not interpret solely the radar echo but also the mixture with the system noise.
Sources of noise that influence the sensor
Instrument noise is inherent in every SAR sensor and there are numerous sources from which this uncertainty can evolve from such as:
- ambient signals from the instrument and its electronics (e.g. flows of energy in the instrument),
- digitisation process of the signal or
- thermal signals from the instrument.
Signal-to-noise ratio of active microwave systems
The performance of any active measurement systems can be described using a parameter called ‘signal-to-noise ratio’ (SNR). For SAR instruments this implies that the transmitted power will have an impact on the measurements acquired. The level of noise that is related to a SAR sensor is related to the measurement sensitivity. This being said, measurement differences below a certain level, might not be a difference in measured energy but variations caused by the systematic noise (SNR). To calculate the SNR for a certain sensor or polarimetric channel the following simplified equation is used:
SNR = received signal / system noise
Here, a value of less than one means that a system is generating more noise than the amount of energy that is being received. Consequently, a higher SNR indicates a better performance of any measurement system. Theoretically, the SNR is dimensionless and has no unit. In remote sensing applications however often it is written using dB (decibel).