

Learning objectives of this topic
- Defintion of the spectral domain
- Multispectral vs. hyperspectral remote sensing
- Meaning of spectral signatures
- Impoartance of atmospheric windows
Moving on in the world of remote sensing domains, we will introduce another important variable, which is used to characterize a sensor. The spectral resolution can be seen as the ability of the sensor’s eye – the instrument’s measuring capabilities. Let’s start with a short video giving you an overview of spectral resolution and sensors that cover this domain in different ways.
What is spectral resolution?
The spectral resolution of a given remote sensing sensor describes its ability to monitor the Earth’s surface at specific wavelengths. A sensor with a finer spectral resolution provides more narrow spectral bands (less wavelength covered per individual band). The range of spectral resolution varies between panchromatic (a single and quite wide band) and hyperspectral (100s to 1,000 very narrow bands) sensors. In between these, multispectral instruments can be found. Take a look at the image below to understand how the number of bands influences the way a given area is monitored and signatures that are created.
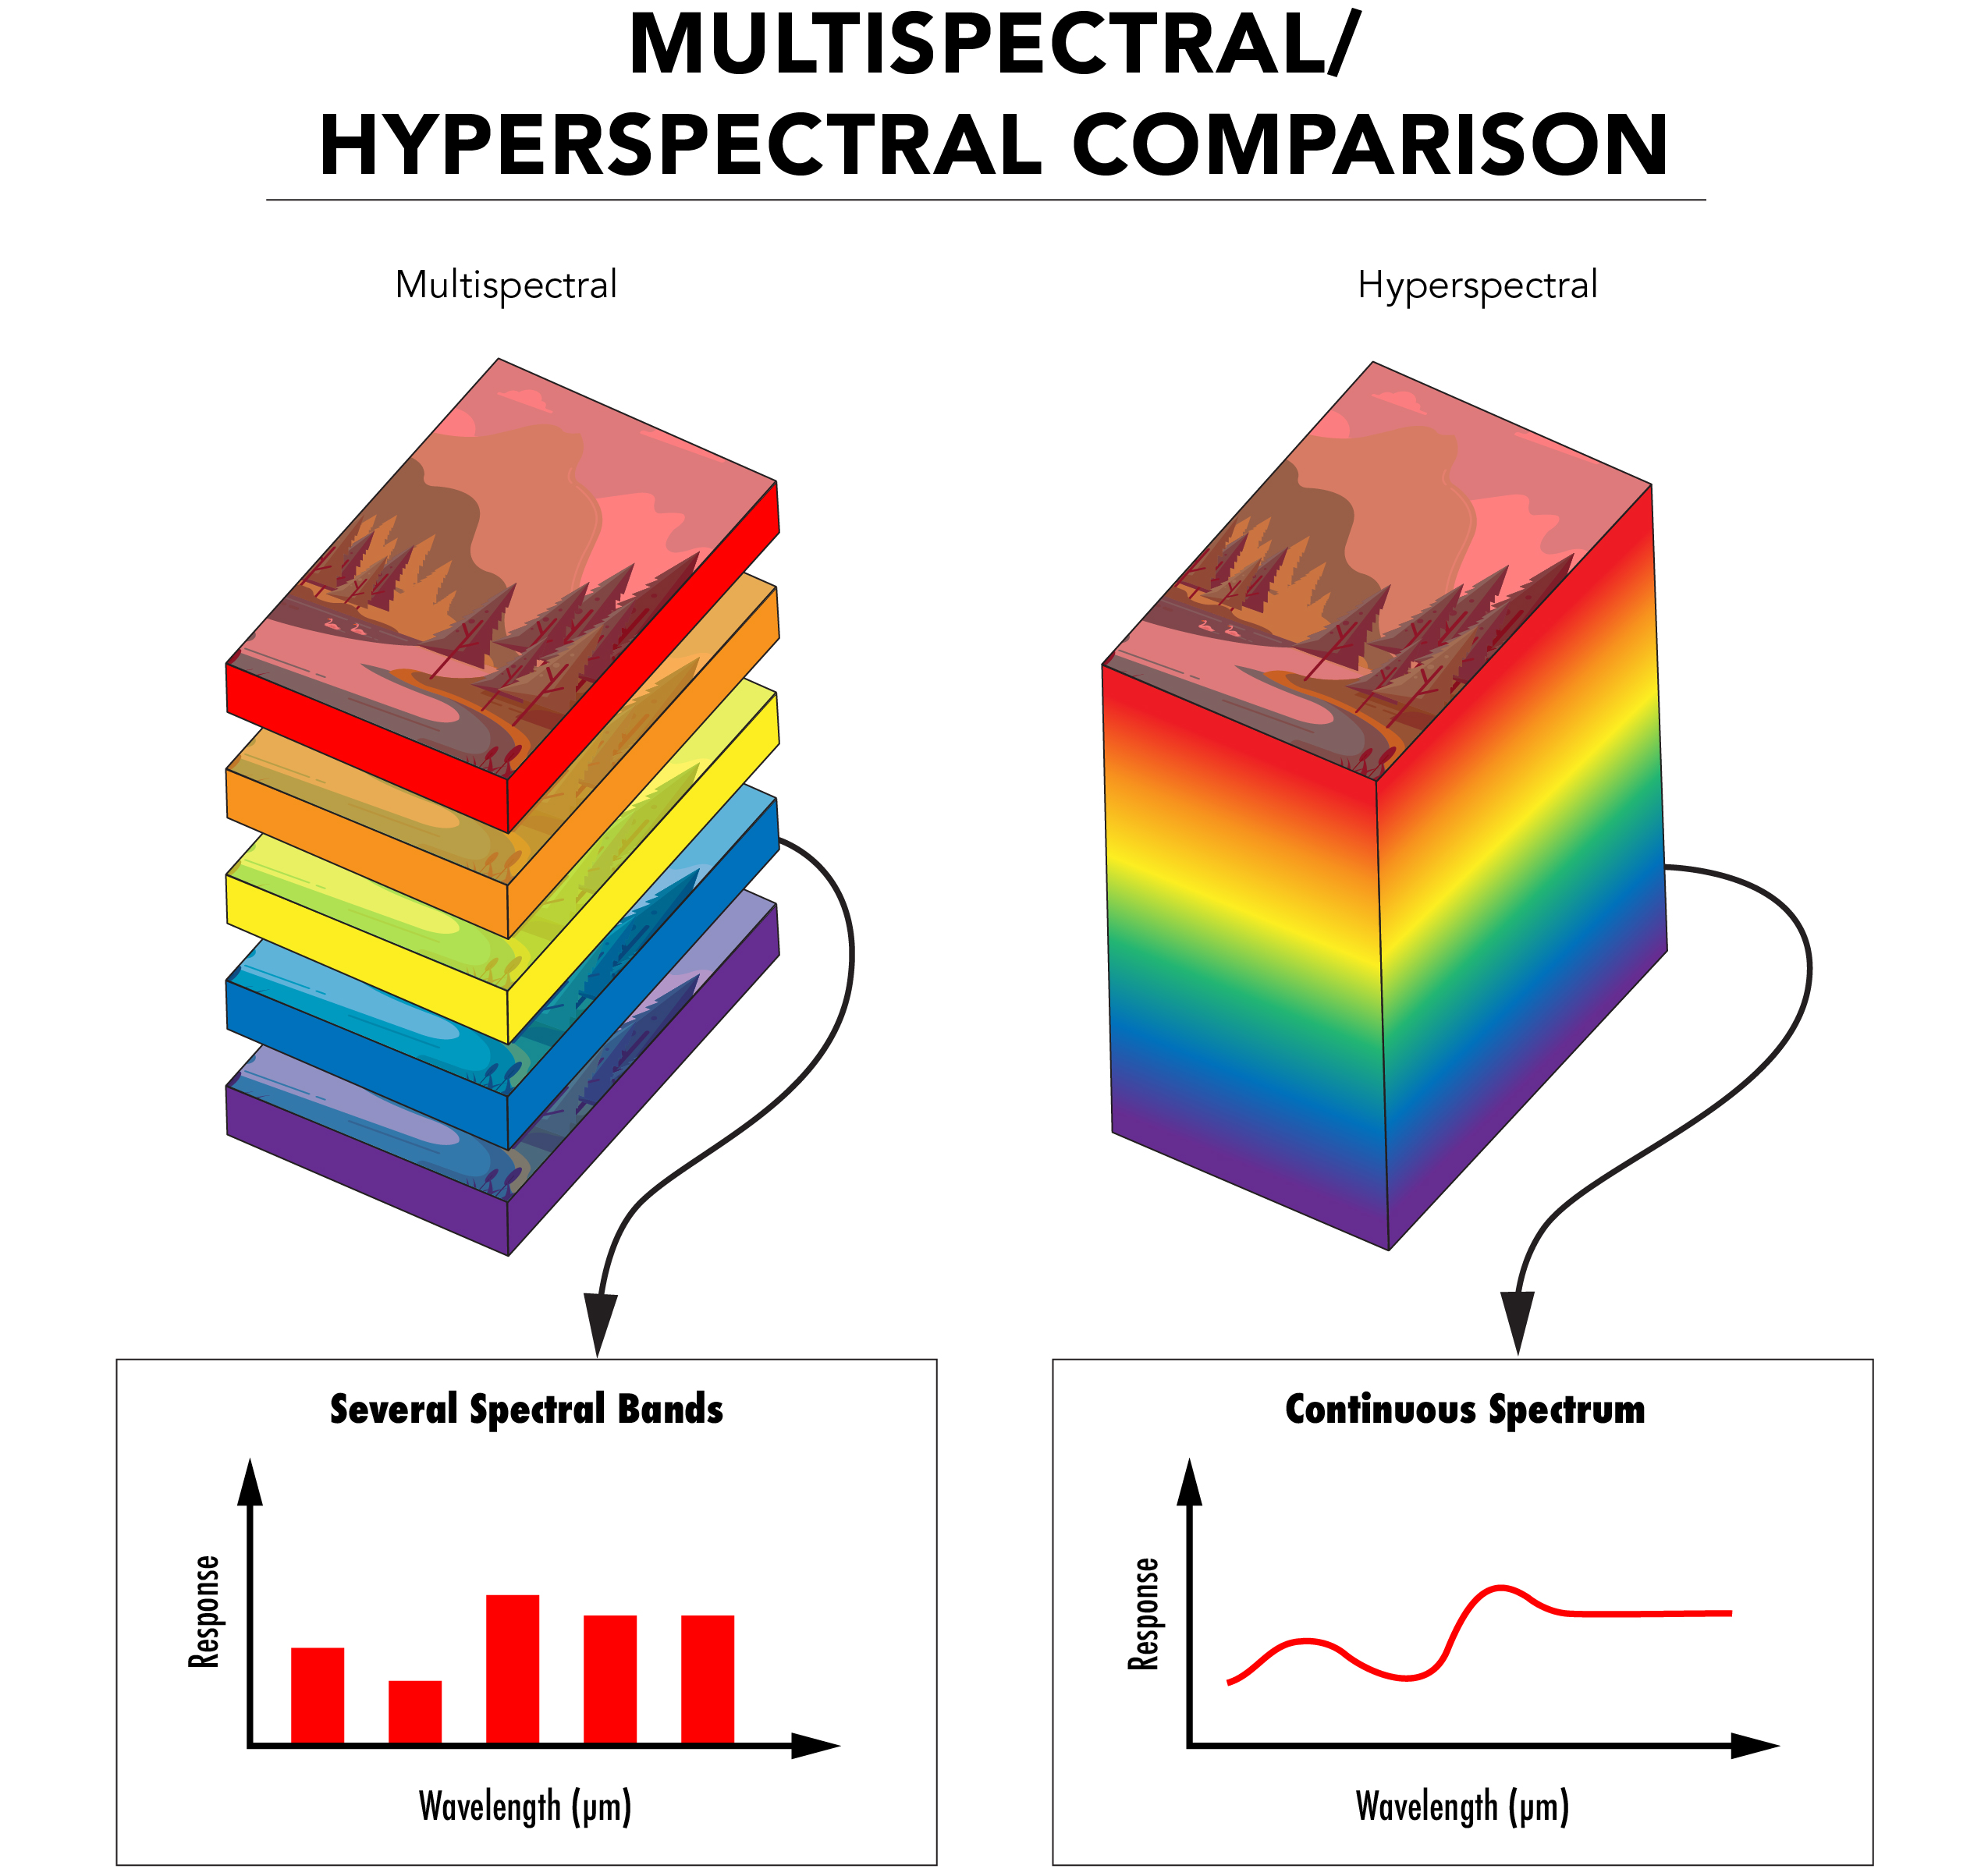
Source: Edmund Optics 2020.
With higher spectral resolution, a sensor can store more bands, containing gray values representing a greater number of wavelength parts.
Influencing factors of spectral suitability
In order to determine which spectral bands are appropriate for certain land applications and consequently for a sensor two important factors should be considered:
1) the spectral signature of objects that ought to be observed and
2) atmospheric windows.
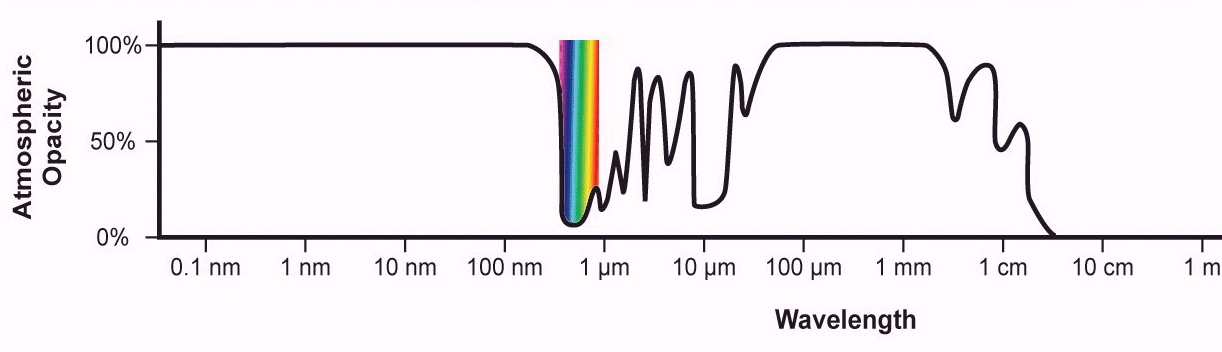
Atmospheric windows
What spectral sensors (shorter wavelengths) see, depends on the atmosphere and its structure, or, whether the wavelengths can pass through the atmosphere or not. Wherever gases or small particles like water drops or dust molecules dominate the atmospheric layer, more parts of the EM spectrum will be absorbed or scattered, resulting in weaker reflectance towards the remote sensing instrument. However, there are some portions of wavelength that are able to travel through the atmosphere more easily; these parts are called atmospheric windows. Consequently, the atmospheric opacity determines which wavelength can travel without losing too much intensity.
Spectral signatures
The so-called ‘fingerprint’ of specific land cover/use objects is an important tool to monitor changes over time. But while the advantage of time series information is obvious and receiving more interest in recent years, the ‘true’ value of data with great spectral resolution can be seen in the identification of features which may only have subtle differences in the spectral response compared to similar ‘targets’. These differences become visible when we look at different land cover/use types in more detail. In the figure below, you can easily distinguish between the view a hyperspectral sensor (in this case DESIS from DLR) has on grasses and water surfaces.
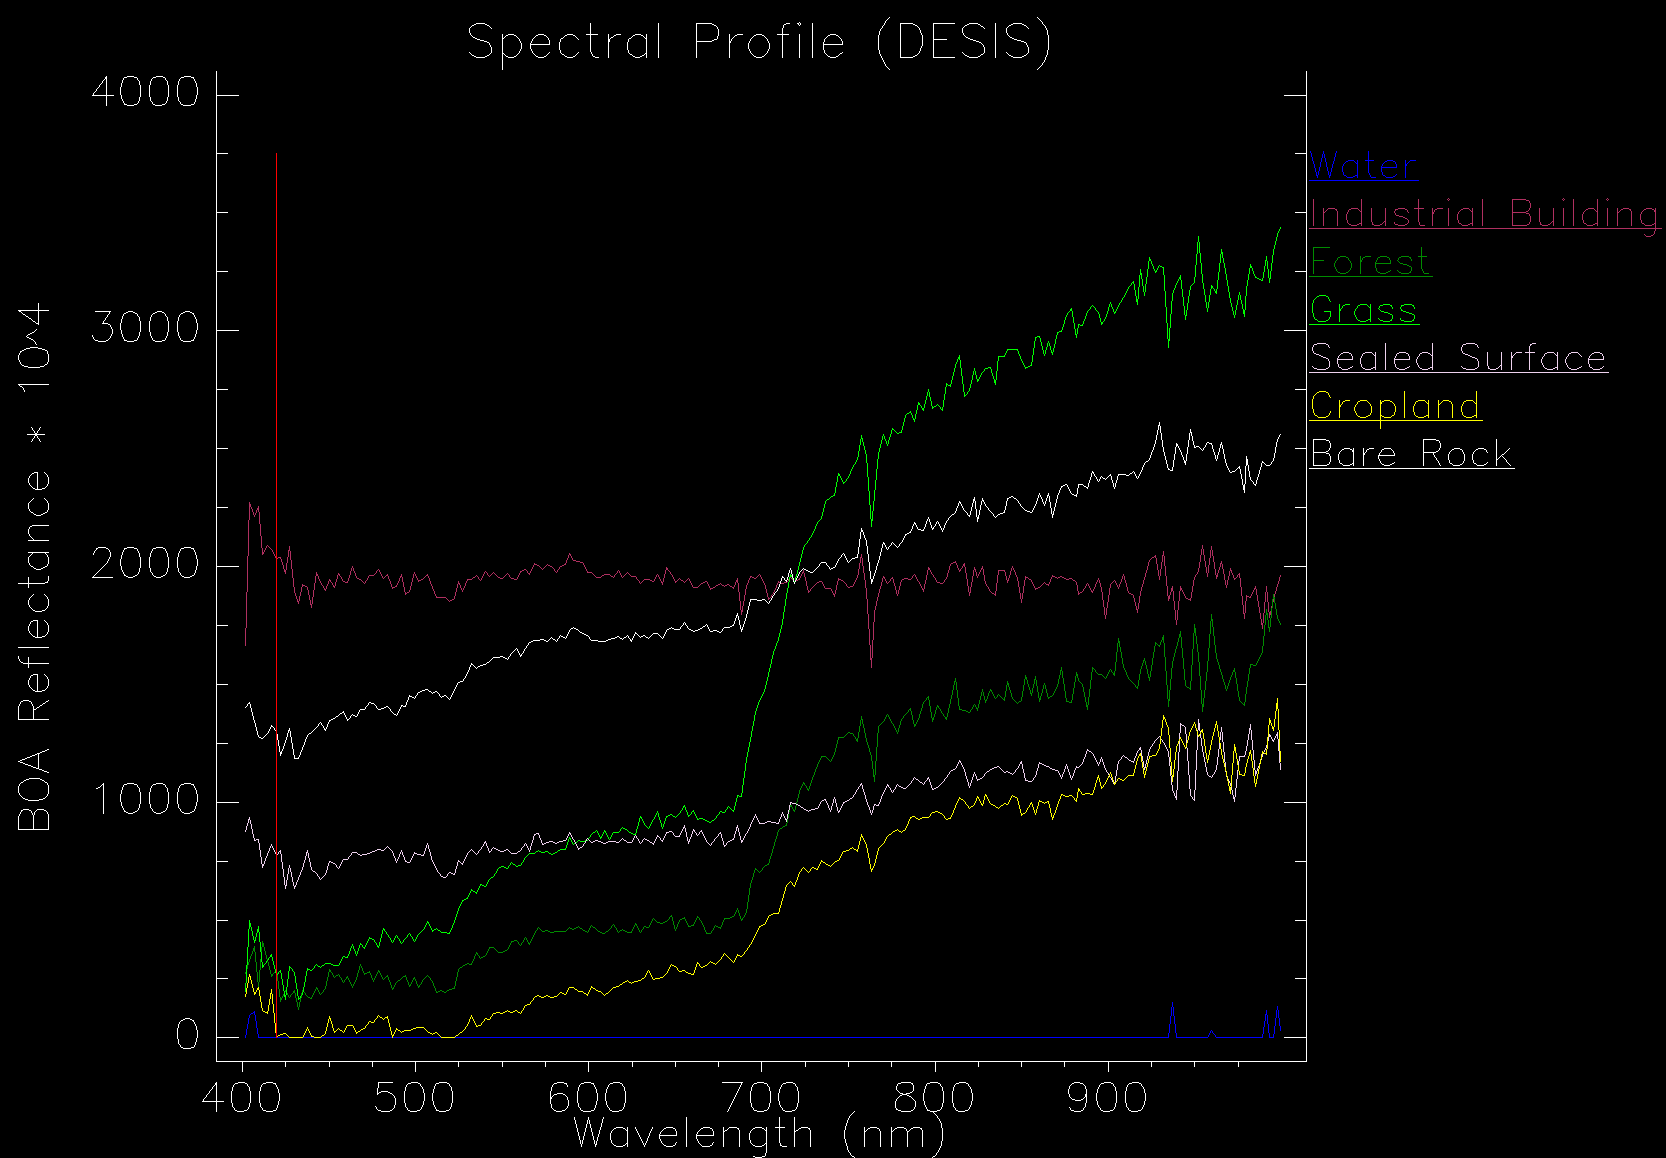
Since the rates of bottom of atmosphere (BOA) reflectance varies significantly between different land cover/use types, very unique signatures can be found. These can be used to distinguish the finest sub-classes of land cover/use types. Understanding of the spectral fingerprint of objects is important to being able to evaluate changes observed from remotely sensed data.
Sources & further reading
Deutsches Zentrum für Luft- und Raumfahrt (DLR, 2019). DLR Earth Sensing Imaging Spectrometer (DESIS). <https://www.dlr.de/os/en/desktopdefault.aspx/tabid-12923/>.
Edmund Optics (2020). Hyperspectral and Multispectral Imaging.<https://www.edmundoptics.eu/knowledge-center/application-notes/imaging/hyperspectral-and-multispectral-imaging/>.
Elachi, C. & van Zyl, J. (2015²). Introduction to the Physics and Techniques of Remote Sensing. Hoboken, USA: John Wiley & Sons, Inc.
Jensen, J.R. (2007²). Remote Sensing of the Environment. An Earth Resource Perspective. Upper Saddle River, USA: Pearson Prentice Hall.
Rees, W.G. (2010²). Physical Principles of Remote Sensing. Cambridge, USA: Cambridge University Press.
Schowengerdt, R.A. (2007³). Remote Sensing. Models and Methods for Image Processing. San Diego, USA: Academic Press.