- Video 00:29-03:50 How geo-spatial tools can help better manage food systems: 1. quantify the problem, 2. support informed decisions that address the problem, 3. Guide where and when to act upon those decisions, 4. Measure the impact of those actions, 5. Revise this cycle and improve the management of food security. An example related to increasing low yields: Mapping where yields are lower than expected, mapping the factors (like soil) that explain why yields are low, guiding where to use improved varieties and management practices, mapping yields before and after interventions, monitoring yields over time and comparing the impacts of different interventions
- Actual examples from the ITC:
- Video 04:38 Example 1: Vegetation Index Crop Insurance (VICI) explanation using NDVI for site-specific threshold systems and payouts for abnormal events. Slide on Ethiopia application with maps (possibly use?). 07:55 Video from a VICI-insured smallholder farmer in ETH (also separately stored on Vimeo)
- Video 11:24 Example 2: Chains of Human Intelligence towards Efficiency and Equity in Agro-Food Trade across the Trans-African Highway (Cheetah). Smartphone app that through crowd-sourcing informs about road quality, bribery, waiting times and other obstacles to good post-harvest handling. 14:27 Video on the tomato example (interview with foreign policy maker Kim Geesink and with Valentijn Venus who did the respective research; all in Dutch with subtitles) (also separately stored on Vimeo)
- Note: this should not become an ad for the ITC. More examples should be collected to present a better mix. Maybe insert a board with six buttons to lead to different examples in the form of videos, infographics and explanations
Suggestions:
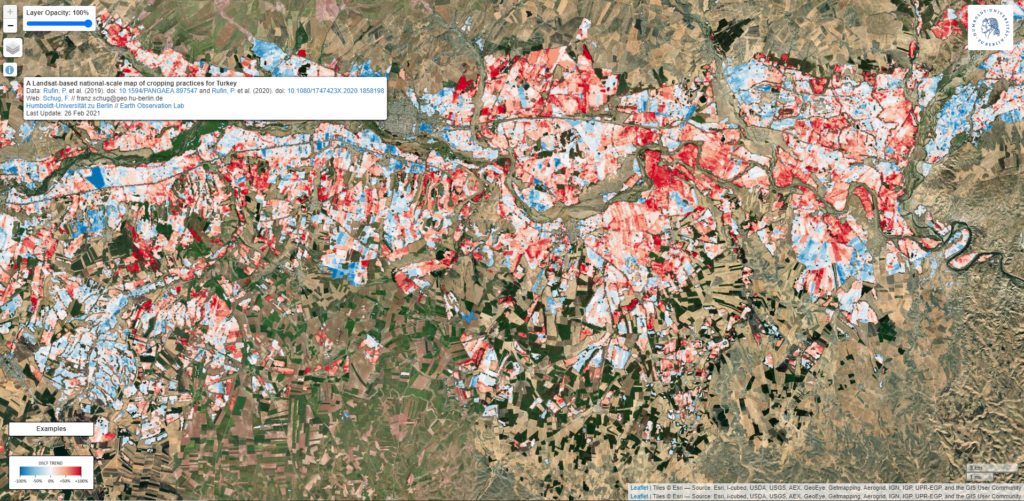
- web map of cropping practices in Turkey (however, this is a study and not a high-end application like using the ones above):
https://ows.geo.hu-berlin.de/webviewer/turkey-cropping/index.html