
Food systems are complex and achieving food security is not a straightforward process. EO is a piece in the middle of the puzzle, but a key one if well-used.
How can EO support food security?
Here are five main „entry points“ where EO and geoinformation science can help improve food security and achieve better management of food systems.

By loading the video, you agree to YouTube’s privacy policy.
Learn more
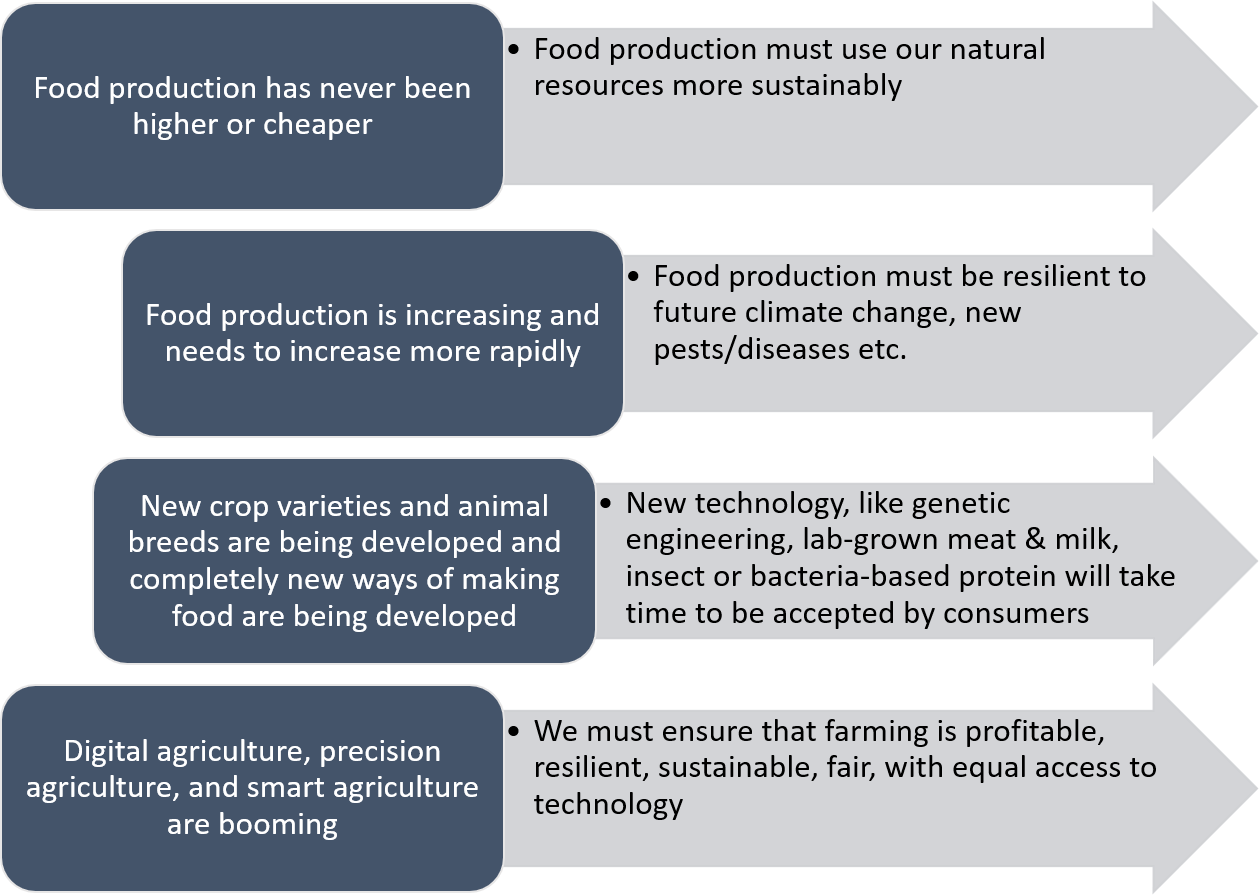
The five entry points for Earth observation:
- Quantify the problem. Where is the yield lower than expected?
- Support informed decisions that address the problem. Why are the yields low?
- Guide actions to act upon those decisions. What can be done to improve the yield?
- Measure the impacts of those actions. What is the progress based on the interventions?
- Monitor progress and improve the management of food systems. How does the yield evolve in time based on the different interventions?
Examples of EO data & tool utilization for food security
There are many examples of using spatial information for food security. Find below a few examples of where EO is integrated in operational systems.
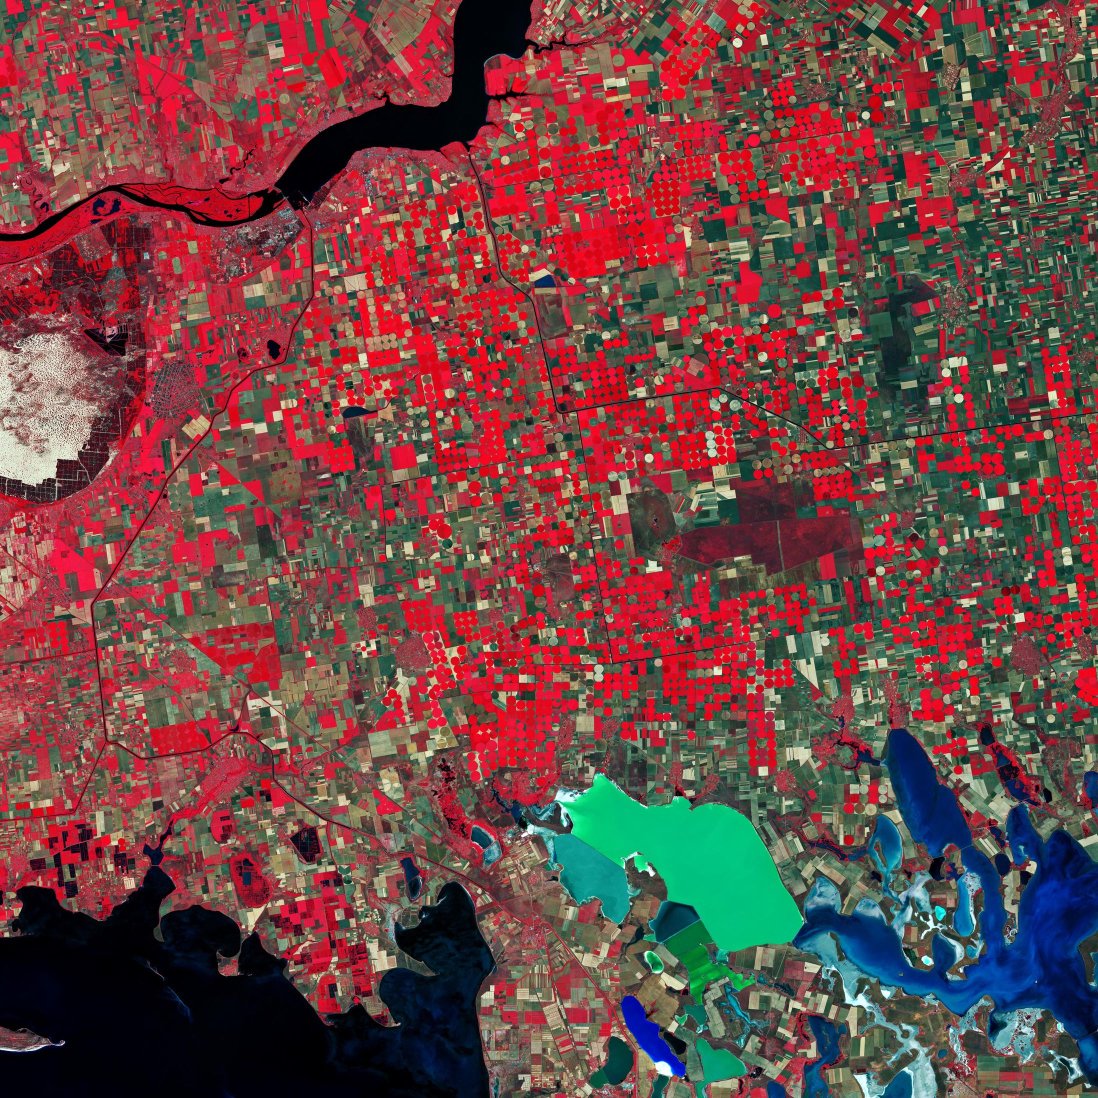
A farm sourcing platform for smart nitrogen management:
A shortage of Nitrogen (N) results in lower yields, whereas an excess has negative environmental consequences.
The BELCAM collaborative platform contributes to smart nitrogen management of wheat, potato, and maize in Belgium by providing users with satellite-based N recommendations at the parcel level. Growing-season-specific data are produced from reflectances and vegetation indices derived from Sentinel-2.
Vegetation Index Crop Insurance (VICI) in Ethiopia
Farming is a risky business. Farmers must invest in their land/crop at the start of the season but may lose their investment due to drought.
VICI is for farmers, the insurance and banking industry, and government agencies in Ethiopia. Farmers take out a loan at the start of the season. The loan is insured. If there is a drought, the insurance covers the cost of the loan.
Time series of vegetation indices (NDVI) is used to develop site-specific drought thresholds. If the threshold is crossed then there is a payout in that location. And the degree to which the threshold is crossed determines the amount of the payout.
GEOGLAM Crop Monitor for Early Warning (CM4EW):
Crop condition information is crucial in countries at risk of famine. Early warning is often critical to trigger early action by humanitarian and aid organizations.
The CM4EW builds on operational regional and global crop monitoring systems and provides a common platform to create consensus and reduce uncertainty across systems. Satellite-based indicators help monitor crop conditions globally. These include NDVI and NDVI anomalies, the Evaporation Stress Index, temperature anomalies, precipitation anomalies, and evapotranspiration anomalies.
In summary
Our food security depends on well-functioning food systems. These systems are complex and involve many stakeholders. These stakeholders require information to best manage and adapt to changing situations. Much of the information they need is spatial (from individual plants to landscapes) and temporal (from minutes to seasons to years). The examples above just scratch the surface of the research and operational use of geo-information for a more food-secure future.
Credit
This topic is created with the help of learning materials kindly provided by Prof. Dr. Andrew Nelson, International Institute for Geo-Information Science and Earth Observation (ITC), University of Twente.
Sources and further readings
Sources
GEOGLAM. (2020, Juni 12). GEOGLAM Crop Monitor. https://cropmonitor.org/index.php/crop-monitor-story-map/
Metasebia Yoseph (Regisseur). (2017, Februar 11). NDVI based Crop Insurance brought to you by Kifiya Financial Technology. https://www.youtube.com/watch?v=pQKJ8euMAEg
NEREUS European Space Agency and European Commission. (2018). The Ever Growing Use of Copernicus acrossEurope’sRegions: A selectionof 99 userstoriesbylocal and regional authorities (p. 277).
Nelson, A. (2022, Januar 13). Geodata for de-risking food systems. LinkedIn. https://www.linkedin.com/pulse/geodata-de-risking-food-systems-andy-nelson/?trackingId=u9sbSrc7STPVZ4iAIQEXEg%3D%3D
Further reading
Kansakar, P., & Hossain, F. (2016). A review of applications of satellite earth observation data for global societal benefit and stewardship of planet earth. Space Policy, 36, 46–54. https://doi.org/10.1016/j.spacepol.2016.05.005
Weiss, M., Jacob, F., & Duveiller, G. (2020). Remote sensing for agricultural applications: A meta-review. Remote Sensing of Environment, 236, 111402. https://doi.org/10.1016/j.rse.2019.111402
Whitcraft, A. K., Becker-Reshef, I., Justice, C. O., Gifford, L., Kavvada, A., & Jarvis, I. (2019). No pixel left behind: Toward integrating Earth Observations for agriculture into the United Nations Sustainable Development Goals framework. Remote Sensingof Environment, 235(111470), 1–14. https://doi.org/10.1016/j.rse.2019.111470
Whitcraft, A., Becker-Reshef, I., & Justice, C. (2015). A Framework for Defining Spatially Explicit Earth Observation Requirements for a Global Agricultural Monitoring Initiative (GEOGLAM). Remote Sensing, 7(2), 1461–1481. https://doi.org/10.3390/rs70201461
Congratulations!
You concluded the module “Food Security”.
Complete the quiz below to finish the module and get your certificate!
Discussion
-
Earth observation for food security
Sorry, there were no replies found.
Log in to reply.