Welcome to the lesson ‘Land’
In the previous lesson you have learned all about the radar imaging geometry and the scattering mechanisms that determine the amplitude of the radar echoes.
It’s time to put this theoretical knowledge to use by exploring the fascinating applications of radar data that are possible over the land surface.
Before we discover some radar applications over forests, cities and agricultural areas, we need to introduce some key concepts, namely:
- Interferometry
- Polarimetry
- Time Series
Each of this topics is a key technology when analyzing and interpreting radar data. It is impossible to explain every detail of these techniques within the framework of this course, so don’t worry if not everything is clear to you after these introductions.
The take-away is, that these technologies exist, that you have an idea what they are about and to have a starting point to delve into these amazing technologies if they fit your application and you want to learn more about them.
Ready? Let’s get started!
What is Radar Interferometry?
Interferometry is a key technology in radar remote sensing. This topic is designed to provide an overview of how interferometry works, in order to understand its use for the applications later in this lesson.
Radar interferometry itself is a wide topic that should be covered by a self-contained course. In this course, the most important is to familiarise yourself with the topic and understand how it works conceptually.

By loading the video, you agree to YouTube’s privacy policy.
Learn more
Amplitude? Phase? Coherence?
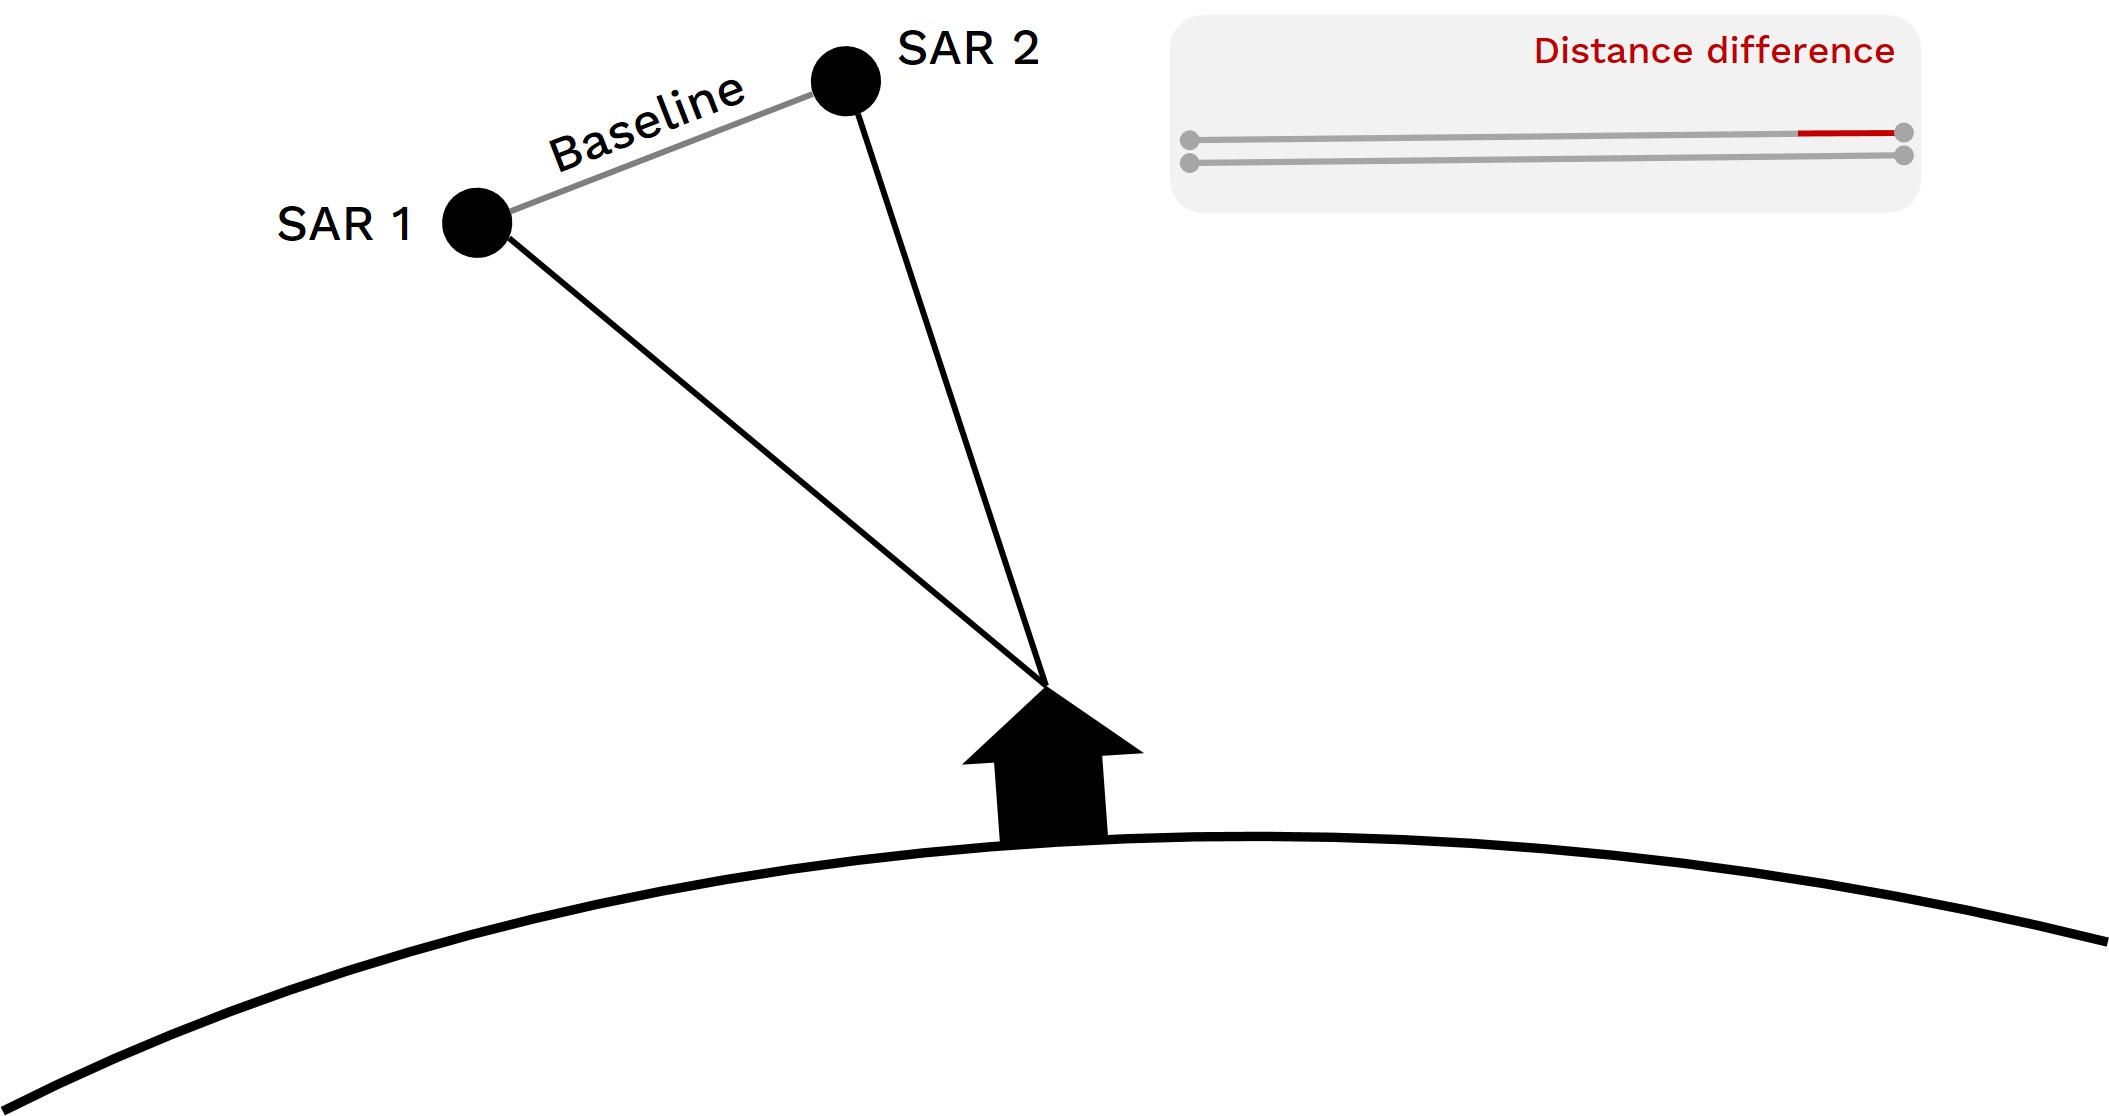
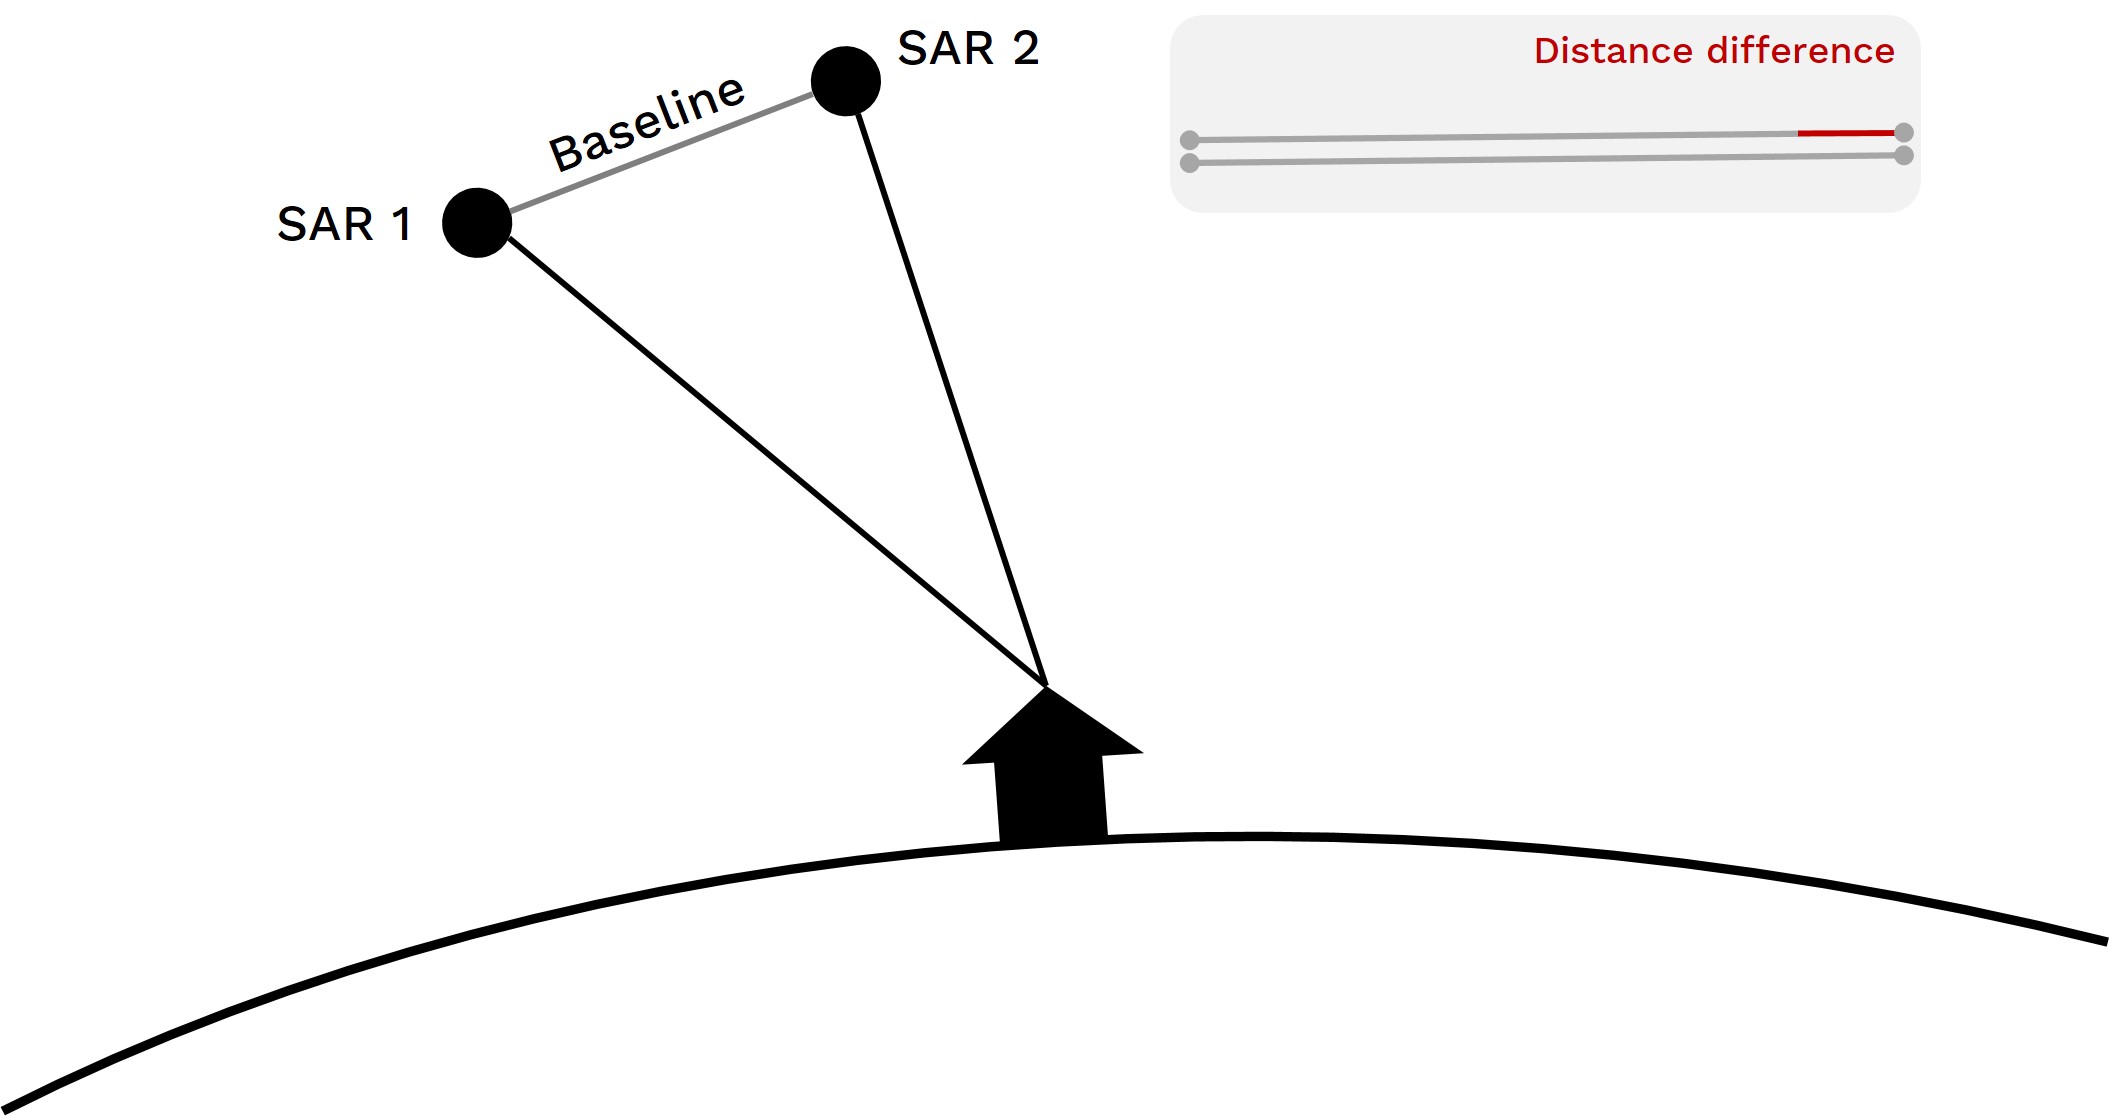
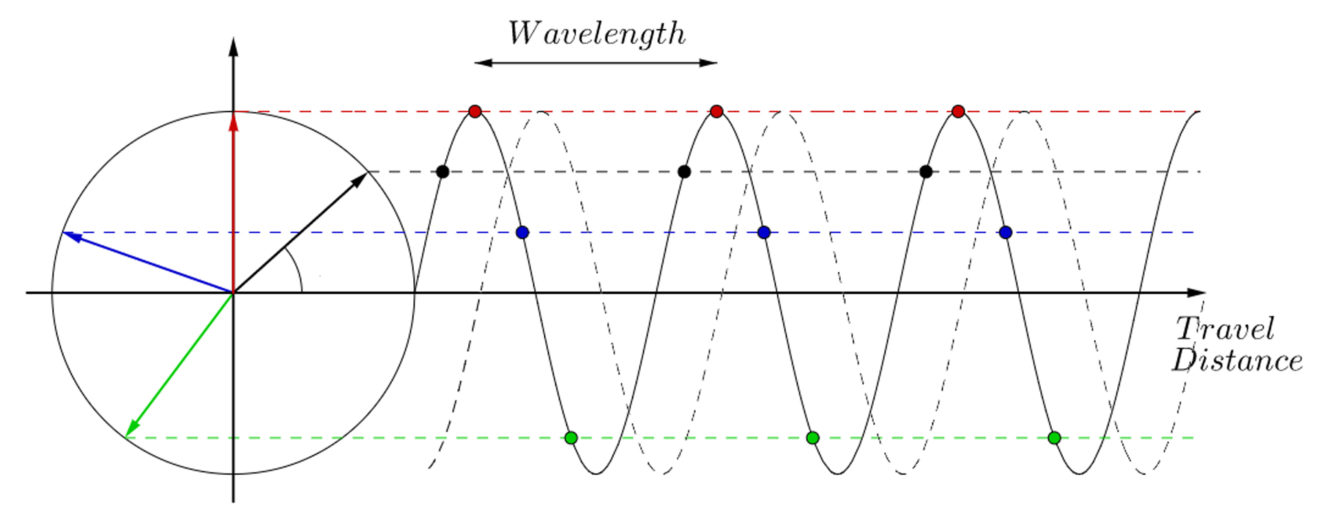
A radar signal contains amplitude and phase information. Amplitude is the strength of the radar response and phase is the fraction of one complete sine wave cycle (a single SAR wavelength). The phase of the SAR image is determined primarily by the distance between the satellite antenna and the ground targets.A satellite SAR can observe the same area from slightly different look angles. This can be done either simultaneously (with two radars mounted on the same platform) or at different times by exploiting repeated orbits of the same satellite. The distance between the two satellites (or orbits) is called baseline.
What is the phase?
The radiation transmitted from the radar has to reach the scatterers on the ground and then come back to the radar in order to form the SAR image (two-way travel). Scatterers at different distances from the radar (different slant ranges) introduce different time delays between transmission and reception of the radiation. These delays are equivalent to a phase change between the transmitted and received signals. This is the phase difference that is the basis for the calculation of the interferometric phase.
What is interferometry?
Interferometric SAR (InSAR) exploits the phase difference between two complex (i.e. containing amplitude and phase information) radar observations of the same area, taken from slightly different sensor positions, and extracts distance information about the Earth’s terrain.
What is coherence?
Coherence is a prerequisite for interference. Two waves with a phase difference that remains constant over time are said to be coherent [Woodhouse 2006]. This means, coherence is existing, when the frequencies of the waves are identical, no matter how different the amplitude might be or how large the phase difference is.
Coherence – a measure of interferogram quality
The coherence is therefore a measure of similarity between the two images that form an interferogram. It compares the complex values of the amplitude and the phase of both images combined into a normalized value, ranging from 0 – 1:
0: low coherence, no similarities between the two radar images
1: high coherence, two perfectly identical radar images
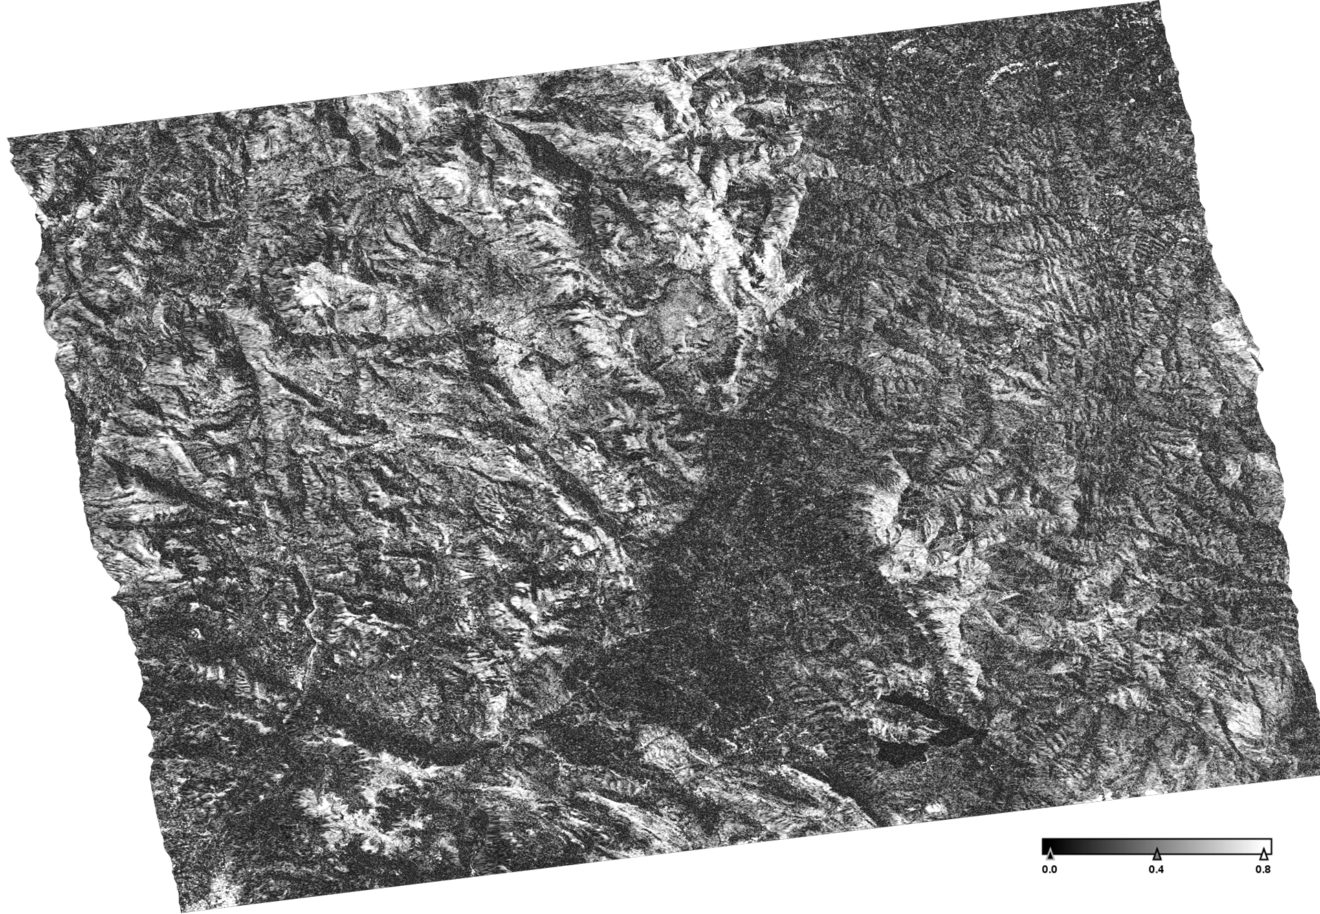
(#1 15-AUG-2016 | #2 27-AUG-2017)
The SAR interferogram is generated by cross-multiplying, pixel by pixel, the first SAR image with the complex conjugate of the second. Thus, the interferogram amplitude is the amplitude of the first image multiplied by that of the second one, whereas its phase (the ‘interferometric phase’) is the phase difference between the images.
By combining the phase of these two images after coregistration, an interferogram can be generated where phase is highly correlated to the terrain topography and deformation patterns can be mapped. If the phase shift related to topography is removed from the interferograms, the difference between the resulting products will show surface deformation patterns occurred between the two acquisition dates. This methodology is called Differential Interferometry (DInSAR).
(esa.int)
Try it yourself
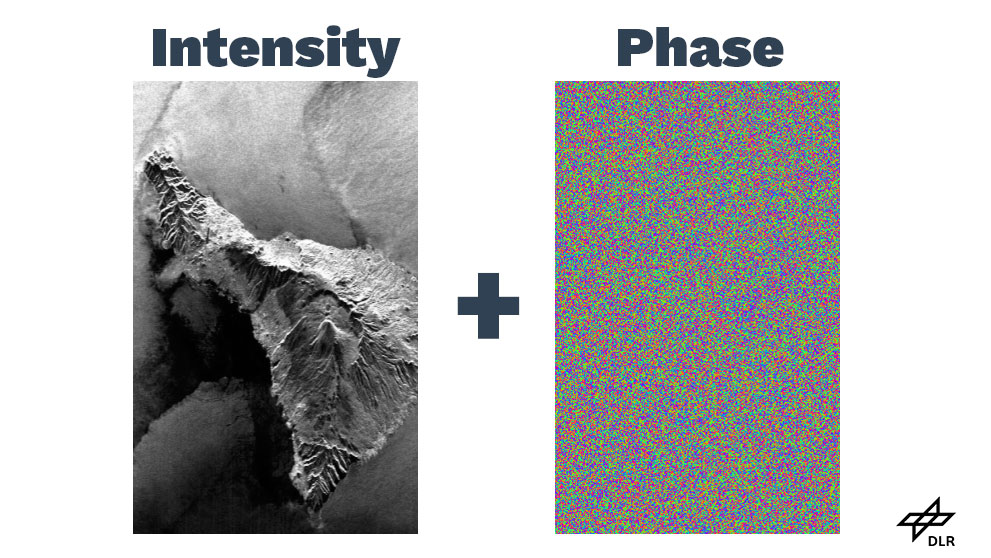
The following explorable explanation can help you to understand the principle of interferogram generation. As you can see, the two phase images by themselves appear random and useless. Let’s see what happens whe you combine them with the amplitude image.
Drag the two phase images exactly on to the amplitude image to generate your first interferogram.
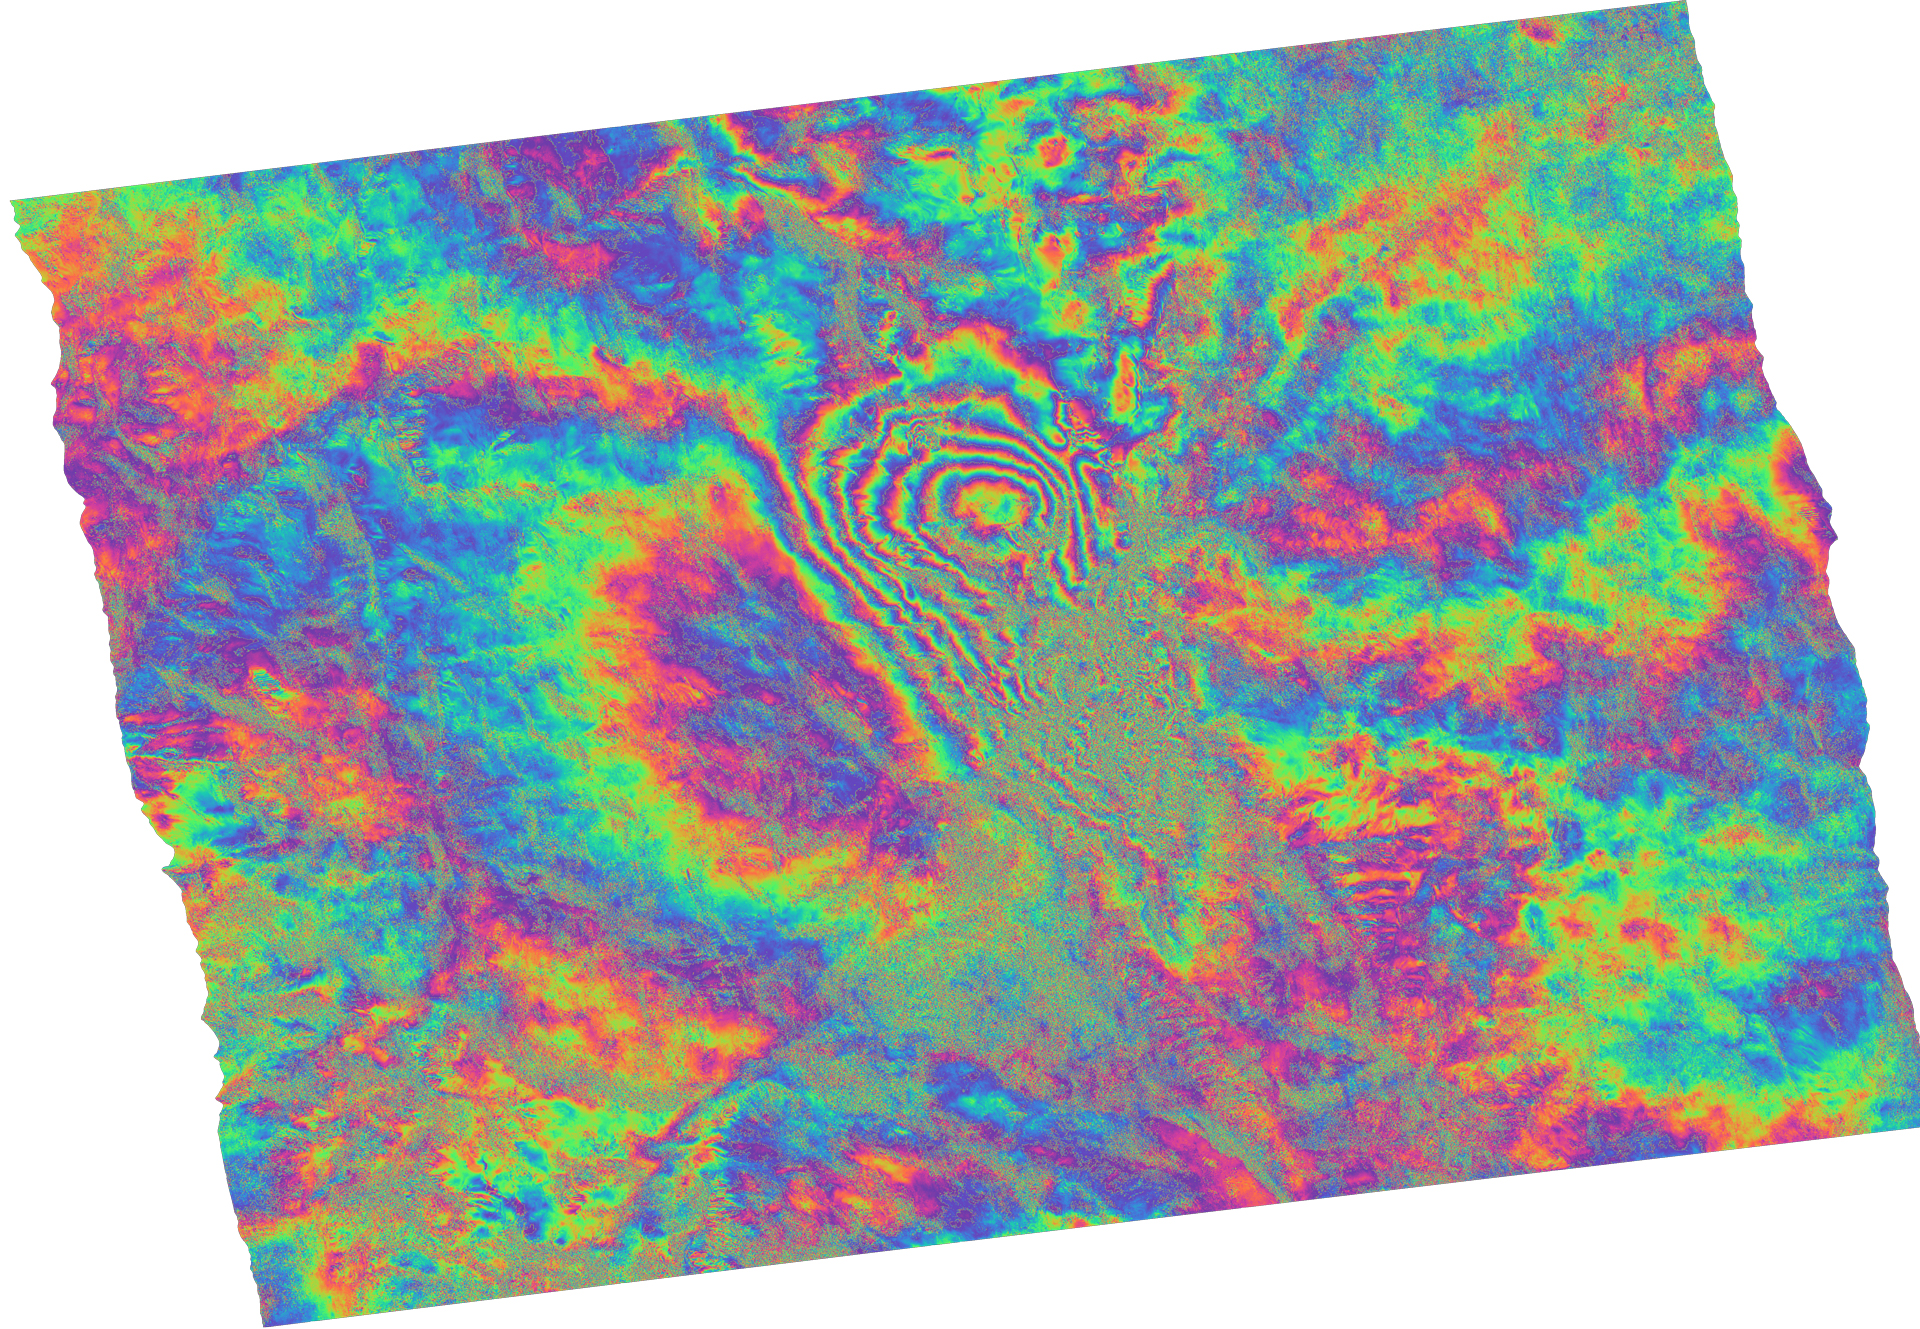
Interferograms – colorful representations of topography and change
Here you can see an example of an interferogram, produced based on the coherence image you saw above.

resulting in an impressive image of an earthquake from August 2016, occurring in Amatrice, Italy.
A valuable resource
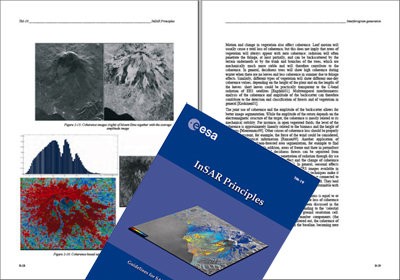
In 2007, ESA published a reference book called InSAR Principles: Guidelines for SAR Interferometry Processing and Interpretation. While written for the interferometric processing of ERS and ASAR images, the key principles still apply to today’s generation of radar satellites.
This publication can help to provide a deeper understanding of the topic and enable exploitation of radar data with interferometric methods for many applications.
Part A is for readers with a good knowledge of optical and microwave remote sensing, to acquaint them with interferometric SAR image processing and interpretation.
Part B provides a practical approach and the technical background for beginners with InSAR processing.
Part C contains a more mathematical approach, for a deeper understanding of the interferometric process. It includes themes such as super resolution and ERS/Envisat interferometry.
More details
The resource repository holds two presentations for a deeper understanding of radar interferometry. The first unit describes basic principles of radar interferometry, the second unit deals with the potential error sources in the interferometric processing chain.
We recommend these resources for users who would like to delve deeper into the topic.