Earth observation or Rremote sensing????
Explanation of below terms. as (h5p) element

EM waves
The application of remote sensing sensors and methods relies on the existence of electromagnetic (EM) radiation. Whether it is being measured through the emissions of an object (reflection of sunlight) or whether radiation is actively sent from an instrument, without this source of energy, we cannot analyze a signal. (LM-Electromagnetic Waves and their Spectrum)
But what are the waves?
Mechanical waves and electromagnetic waves are two important ways that energy is transported in the world around us.
Mechanical Waves

Waves in water and sound waves in the air are two examples of mechanical waves. Mechanical waves are caused by a disturbance or vibration in matter, whether solid, gas, liquid, or plasma. The matter that waves are traveling through is called a medium. Water waves are formed by vibrations in a liquid and sound waves are formed by vibrations in a gas (air). (EiS)
Electromagnetic Waves
Electricity can be static, like the energy that can make your hair stand on end. Magnetism can also be static, as it is in a refrigerator magnet.
A changing magnetic field will induce a changing electric field and vice-versa—the two are linked. These changing fields form electromagnetic waves.
As visualized on the right, an EM wave consists of an electrical field (EF, red) and a magnetic field (MF, blue). The EF varies in magnitude in the direction that is perpendicular to that of the travel direction. A corresponding MF is oriented at right angles to the EF. Both fields travel at the speed of light (~300,000 km/s).
Electromagnetic waves differ from mechanical waves in that they do not require a medium to propagate. This means that electromagnetic waves can travel not only through air and solid materials, but also through the vacuum of space.
A history detour: EM waves
In the 1860’s and 1870’s, the Scottish scientist James Clerk Maxwell developed a scientific theory to explain EM waves. He noticed that electrical fields and magnetic fields can couple together to form electromagnetic waves. He summarized this relationship between electricity and magnetism into what is now referred to as “Maxwell’s Equations“.
Heinrich Hertz, a German physicist, applied Maxwell’s theories to the production and reception of radio waves. The unit of frequency of a radio wave — one cycle per second — is named the hertz, in honor of Heinrich Hertz.
His experiment with radio waves solved two problems. Firstly, he demonstrated concretely, what Maxwell had only theorized — that the velocity of radio waves was equal to the velocity of light. This proved that radio waves are a form of light. Secondly, Hertz figured how to make the electric and magnetic fields detach themselves from wires and go free as Maxwell’s waves — electromagnetic waves. (LM)
watch the video from Prof. Ian Woodhouse

By loading the video, you agree to YouTube’s privacy policy.
Learn more
How do we describe an EM wave?
The terms light, electromagnetic waves, and radiation all refer to the same physical phenomenon: electromagnetic energy. This energy can be described by frequency (f), wavelength (λ) and the speed of light (c). All three are related mathematically such that if you know two of these, you can calculate the missing third variable using this equation:
c = \lambda f
Thus, EM waves can be described through the characteristics of two parameters: a) wavelength and b) frequency. Both are closely correlated (inversely) and depend on each other.
Wavelength
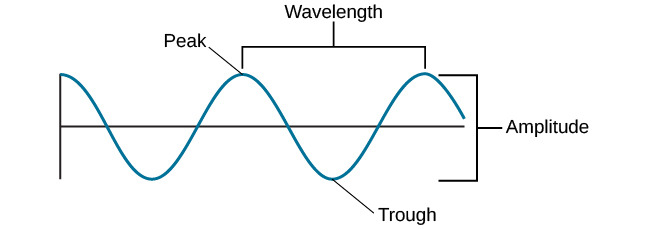
Electromagnetic waves have crests and troughs similar to those of ocean waves. The distance between crests is referred to as ‘wavelength’ and is denoted with the symbol λ. The shortest wavelengths are just fractions of the size of an atom, while the longest wavelengths scientists are currently studying can be larger than the diameter of our planet.
Frequency
The number of crests that pass a given point within one second is described as the frequency of the wave. One wave or cycle per second is called a Hertz (Hz), after Heinrich Hertz who established the existence of radio waves. A wave with two cycles that pass a point in one second has a frequency of 2 Hz.
The amplitude is another important variable that characterizes the distance between the peak and trough of a wave. With these three measures (wavelength, amplitude, frequency), you are now able to describe an EM wave.
Explore the unique features of an EM wave
This interactive tool gives you a hands-on experience of the frequency and the amplitude of a wave, two very important parameters. Try the sliders below to get a feel of what these parameters actually mean.
|
The spectrum of EM radiation
Electromagnetic energy travels in waves and spans a broad spectrum from very long radio waves to very short gamma rays. The human eye can only detect only a small portion of this spectrum called visible light. A radio detects a different portion of the spectrum, and an x-ray machine uses yet another portion. Scientific instruments use the full range of the electromagnetic spectrum to study the Earth, the solar system, and the universe beyond.
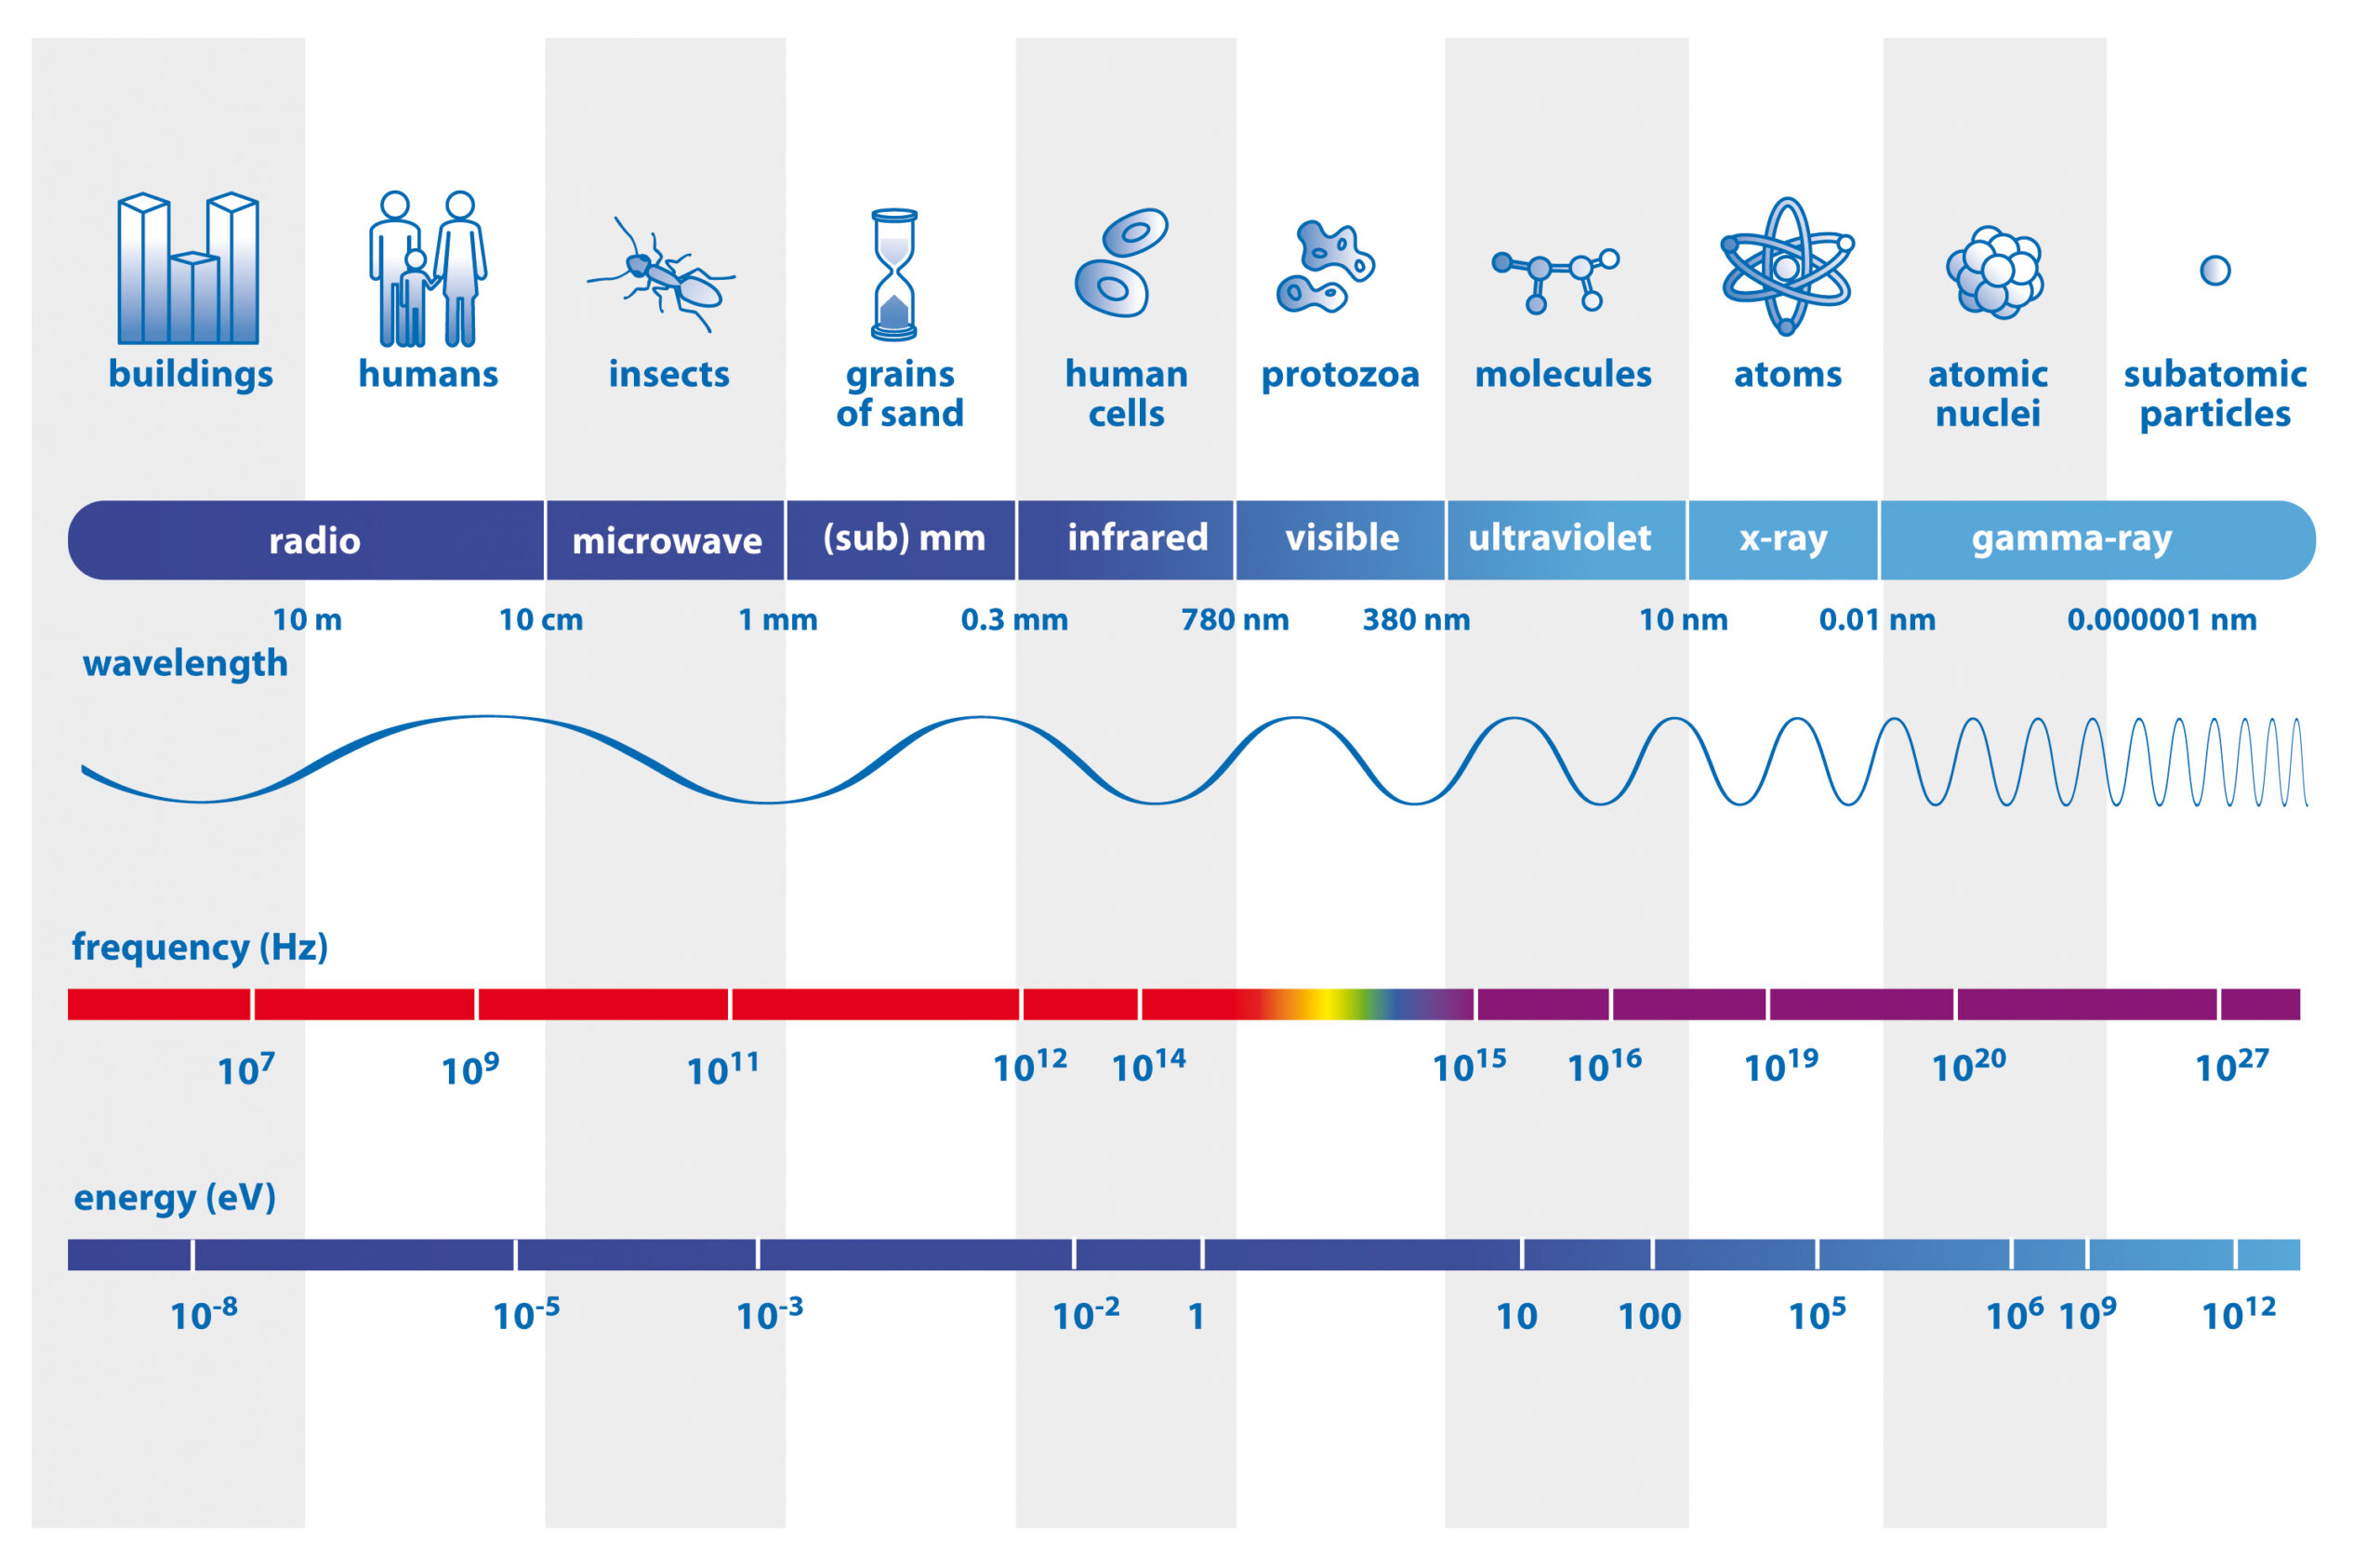
The graphic above demonstrates the different portions of the electromagnetic spectrum, including their names, wavelengths, and frequencies. It also depicts the scale of objects/organisms which can interact with the given wavelength and how life is influenced by them. Keep in mind, that every portion of light, whether it is short- or long waved, corresponds to a distance, that we could measure to indicate why certain objects are more influenced by it than others.
Sources & further reading
AWF-Wiki (2013). Electromagnetic Radiation. <http://wiki.awf.forst.uni-goettingen.de/wiki/index.php/Electromagnetic_radiation>
Centre for Remote Imaging, Sensing & Processing (CRISP) (2001). Principles of Remote Sensing. <https://crisp.nus.edu.sg/~research/tutorial/rsmain.htm>.
Elachi, C. & van Zyl, J. (2015²). Introduction to the Physics and Techniques of Remote Sensing. Hoboken, USA: John Wiley & Sons, Inc.
European Space Agency (ESA). (2019). Educational Support. The Electromagnetic Spectrum. <https://sci.esa.int/web/education/-/50368-the-electromagnetic-spectrum>.
Jensen, J.R. (2007²). Remote Sensing of the Environment. An Earth Resource Perspective. Upper Saddle River, USA: Pearson Prentice Hall.
Lumen Learning. Waves and Wavelengths. <https://courses.lumenlearning.com/atd-bhcc-intropsych/chapter/waves-and-wavelengths/>
Rees, W.G. (2010²). Physical Principles of Remote Sensing. Cambridge, USA: Cambridge University Press.
Schowengerdt, R.A. (2007³). Remote Sensing. Models and Methods for Image Processing. San Diego, USA: Academic Press.
On the way to the Earth’s surface – Atmospheric Interaction

Learning objectives of this topic
- Atmosphere in Remote Sensing context
- Scattering mechanisms in the atmosphere
(linked with natural phenomena) - Absorption in the atmosphere
In this topic, you will learn about the interactions that take place between the different forms of radiation you learned in previous chapters with the Earth’s atmosphere. The layer surrounding our planet has tremendous effect on the signal that we are measuring. While some wavelengths are more or less immune to this kind of influence (you will learn about this later), others produce uninterpretable signals. The atmosphere is not a vacuum and, therefore, the radiation gets altered in different ways.
A protective layer – the atmosphere
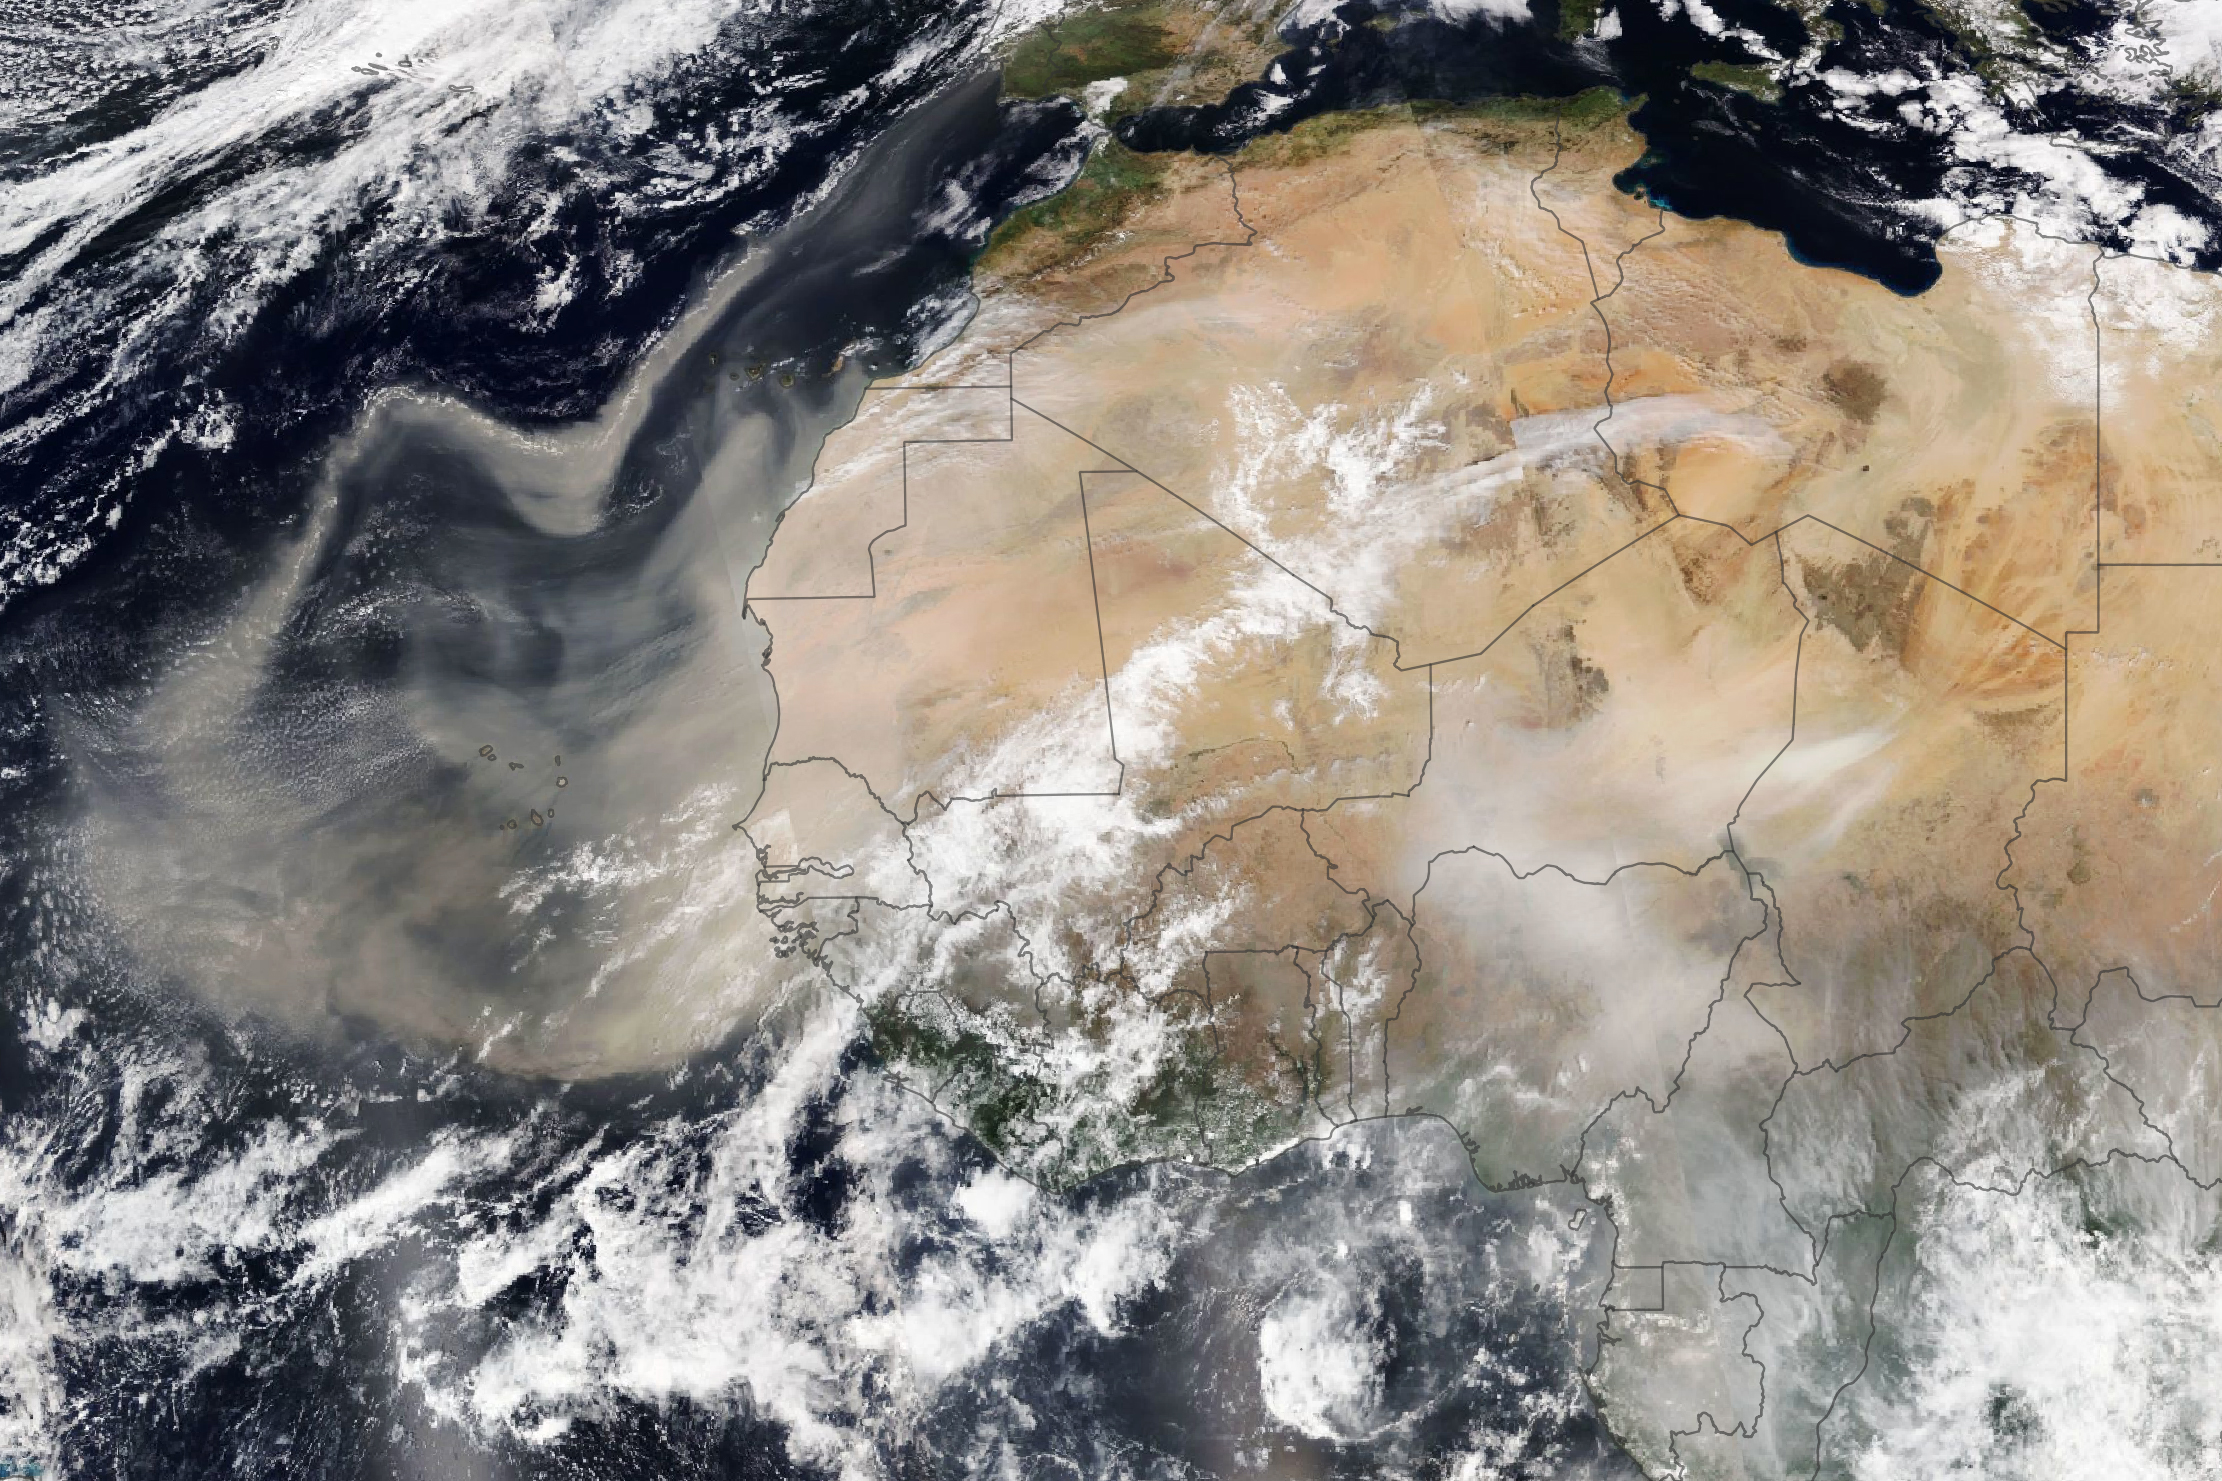
Before solar radiation reaches the Earth’s surface (this distance is referred to as ‘path length’), the atmosphere will influence it in different ways. Hence, the strength of different types of electromagnetic (EM) radiation is severely transformed through the course of the atmosphere as it consists of molecular nitrogen, oxygen, water vapor and particles (aerosols) such as dust, smoke or industrial pollution. The impact of such particles can be massive. In February 2021, great amounts of sand from the Sahara desert were relocated to Europe due to seasonal winds, heavily affecting the signal that passive sensors measure (lower right).
The changes in the radiation can vary with wavelength, condition of the atmosphere, and the position of the sun. So, how does the atmosphere interact with the radiation? Generally, the atmosphere has its strongest impact on the shortest wavelengths used in remote sensing, such as the visible and the infrared spectrum.
Different mechanisms affect the radiation. Absorption is caused, for example, by the presence of water vapor in the Earth’s protective layer. Of course, when arguing from a remote sensing perspective, the atmosphere can also be seen as a hindering factor regarding image interpretation and retrievals of e.g. “true” surface reflectance. Scattering and absorption in the atmosphere cause a transmission loss of the solar radiation before it reaches the Earth’s surface. In parts of the EM spectrum, the atmosphere is hardly or not at all transparent, thus these parts are not suitable for certain wavelengths used in RS. Those parts of the spectrum where the atmospheric transmittance is high (depending on the wavelength of interest), which are specifically useful for RS applications, are called ‘atmospheric windows’. Common atmospheric windows are visualized below.
Scattering in the atmosphere
Through the route that the radiation takes to pass the Earth’s atmosphere, a variation of physical processes takes place that alter the EM waves. Processes of scattering and (partial) absorption define the appearance of the Earth and its surrounding layer and their modelling is complex, while they are the most relevant ones to remote sensing applications. Essentially, there are three types of scattering: 1) Rayleigh, 2) Mie and 3) nonselective.
Why is the sky blue?
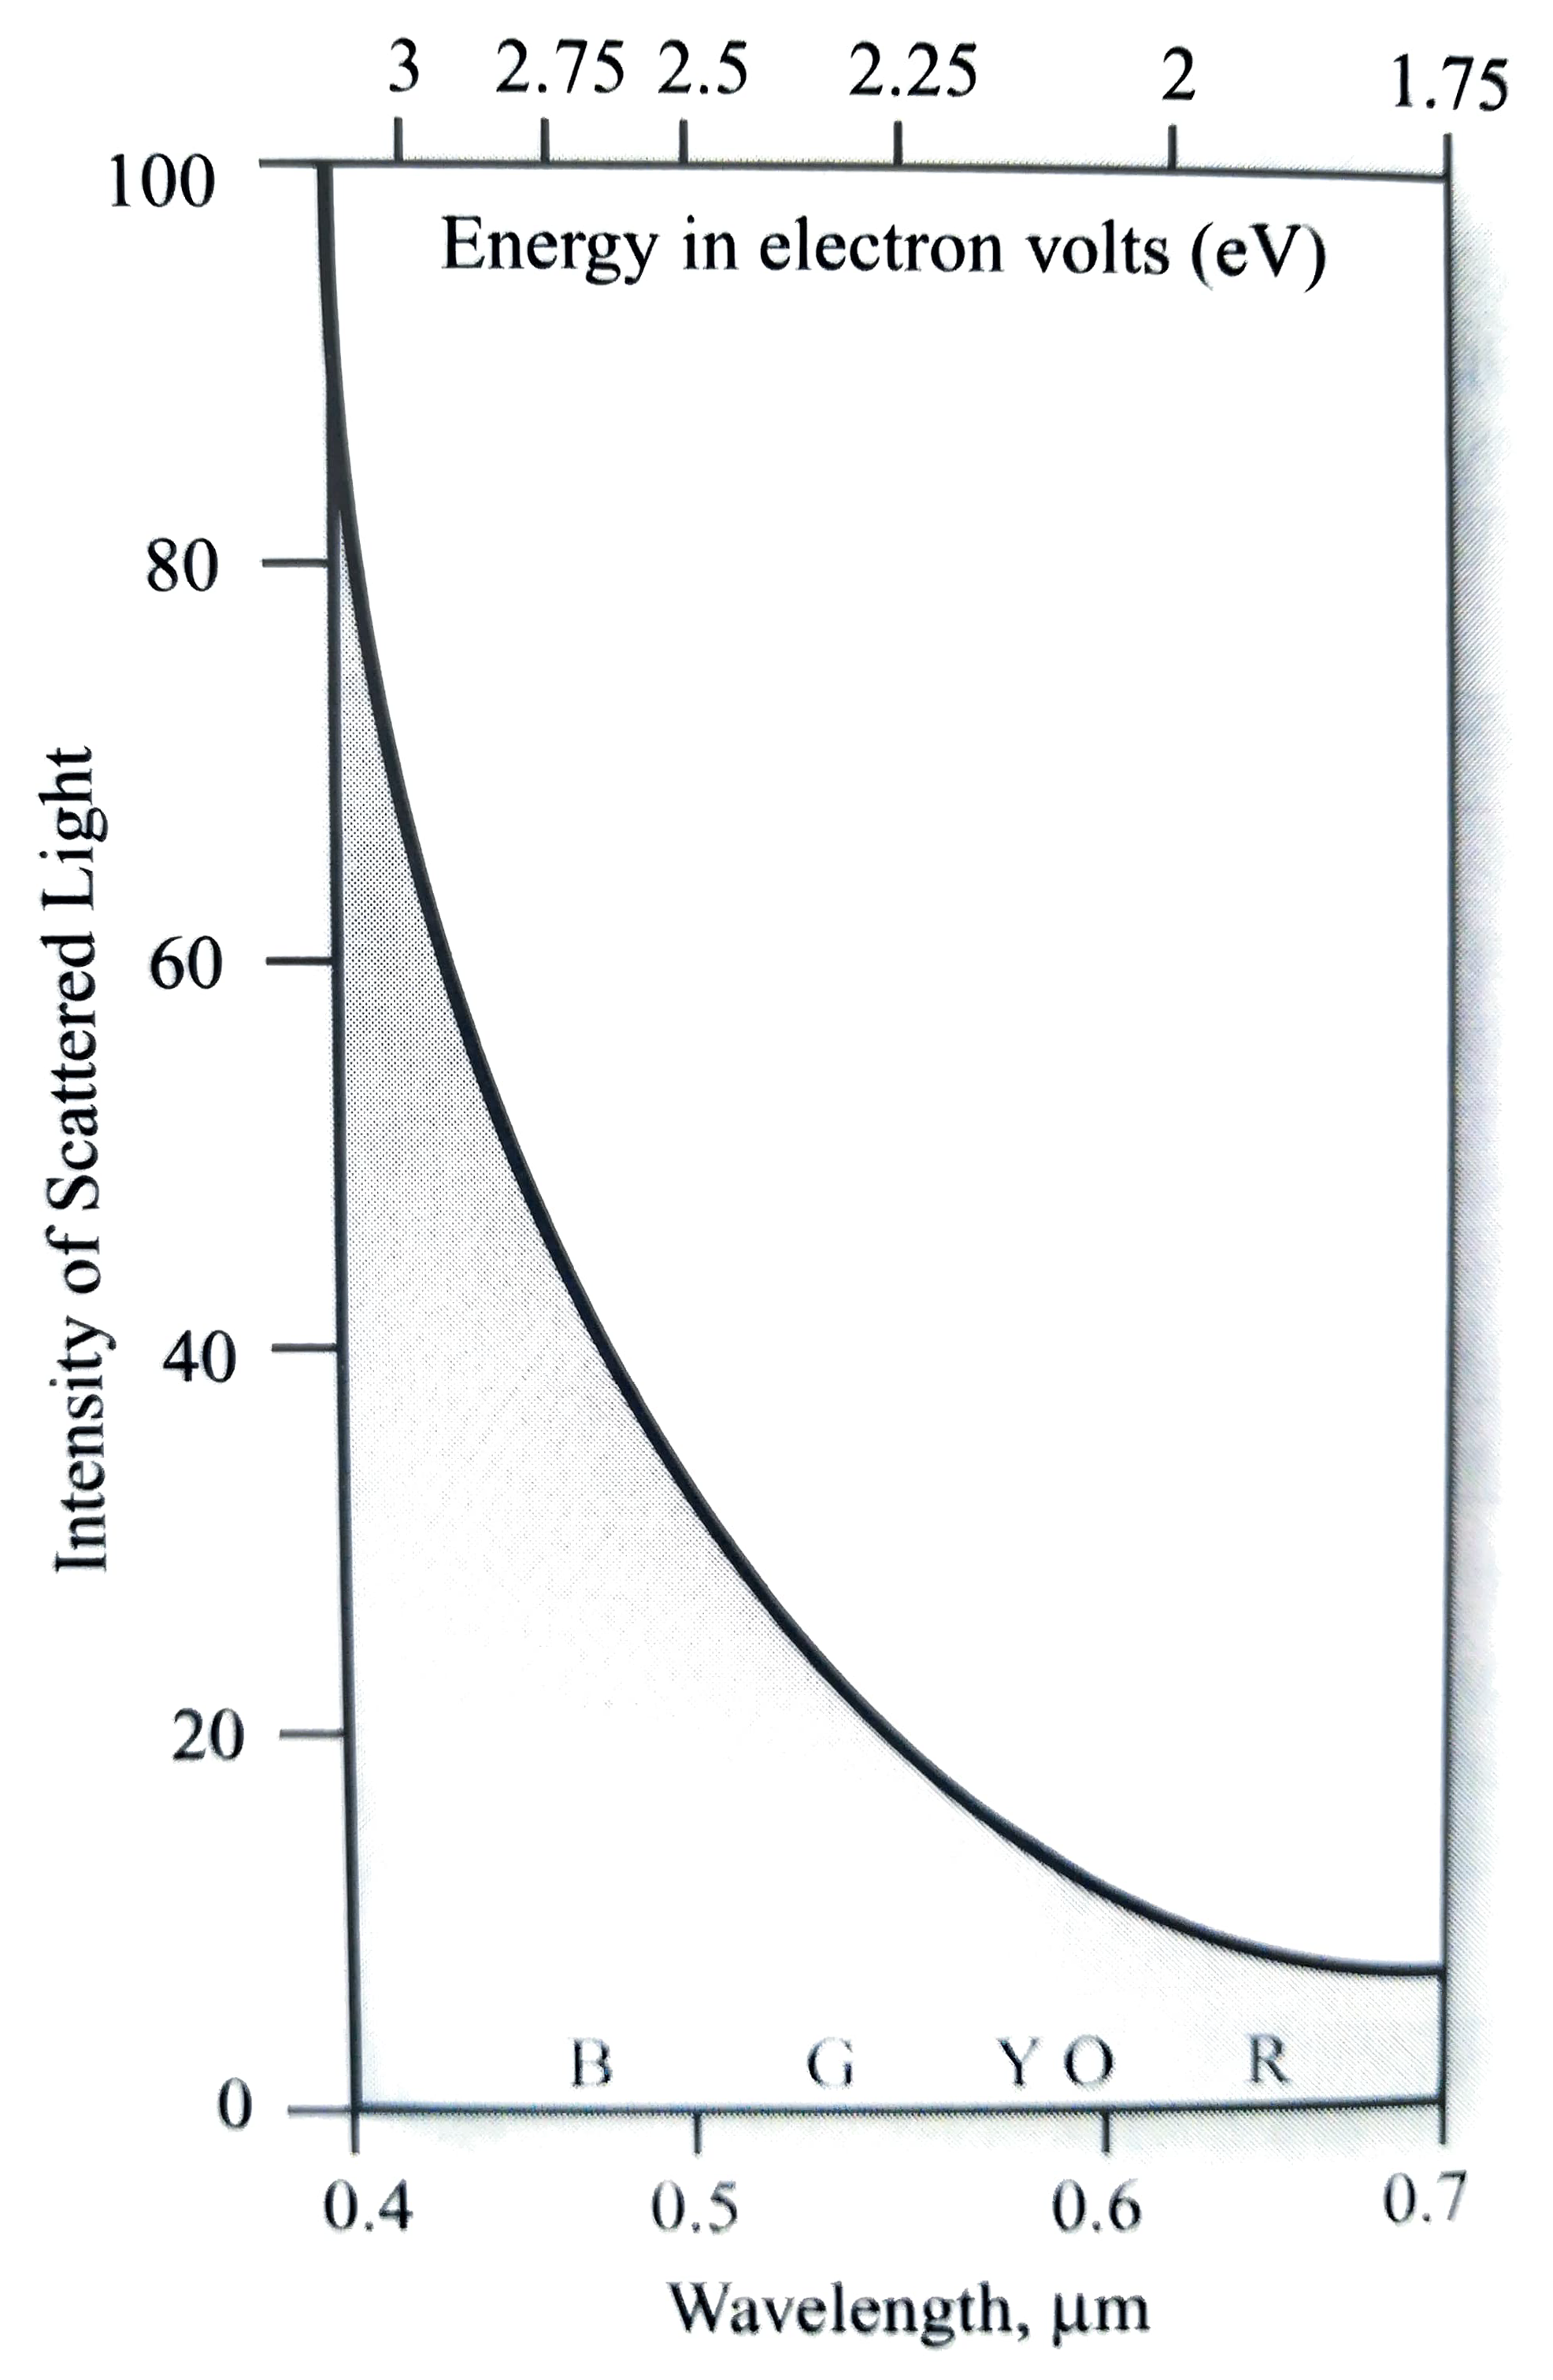
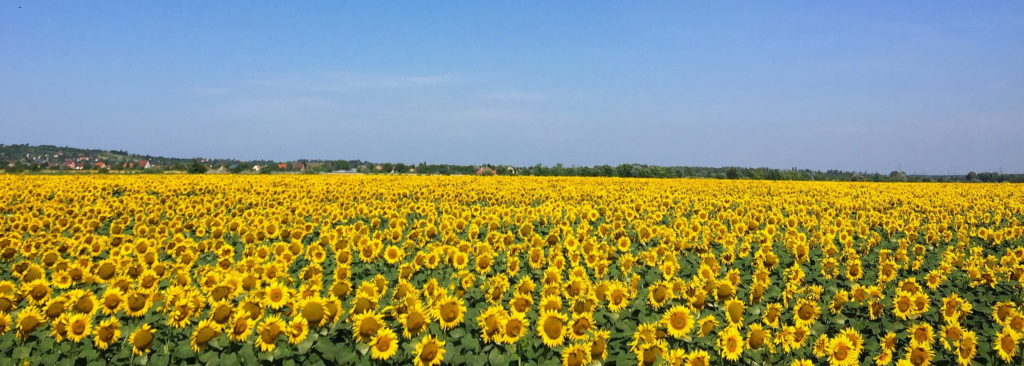
The color of the sky as we see it is usually a shade of blue. This can be attributed to the location of blue light in the visible part of the EM spectrum (approximately 0.4 – 0.7 µm or 400 – 700 nm). Due to its very short wavelength, it is most likely to be scattered from the smallest particles in the atmosphere. This is also displayed in the figure on the right side. In particular, in the upper layer of the atmosphere, this process called ‘Rayleigh scattering‘ (or ‘molecular scattering’) is common. While longer wavelengths simply pass through the particles, shorter wavelengths exhibit a greater probability of being scattered. The molecules involved in the scattering process are usually the size of 1/10 of a wavelength.
The plot on the right displays why blue is so dominant. The intensity of scattered light is greatest in the blue part of visible spectrum. You can see that the amount of Rayleigh scattering varies inversely with the fourth power of the wavelength. This scattering mechanism is strongest between 2 and 8 km above the Earth’s surface, where the proportion of gas molecules is the largest.
When sunrises are redder than usual.
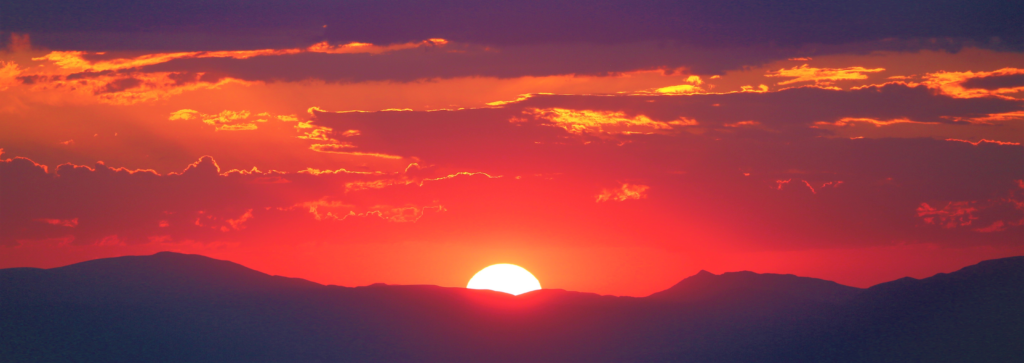
When the particle size/diameter (d) is approximately equal to the wavelength (λ) another process comes into play. You can see this behavior illustrated in the figure on the right. This process, called Mie scattering, is interacting stronger with longer wavelengths, when compared to Rayleigh scattering. In areas where the air pollution is greater or the amount of smoke and dust particles is higher, more of the violet and blue portions of the EM spectrum will be scattered away and the reddish tones directed to the eye.
The size of particles, which lead to Mie scattering, such as dust or smoke particles, vary in size between 0.1 to 10 times the wavelength of the given EM wave.

Why do clouds appear white?
Moving even further down the atmosphere, where particles diameters exceed λ of the incident radiation by factors > 10, nonselective scattering is the third important process happening in the atmosphere. It occurs when the particles are significantly larger than the wavelength. Consequently, water droplets and ice crystals lead to similar scattering in all visible wavelengths, resulting in the white appearance of clouds.

Absorption in the atmosphere
Understanding where our atmosphere absorbs which parts of the EM radiation is crucial to be able to understand the signal a remote sensing instrument is receiving. A main difference between atmospheric absorption and scattering is the effective loss in energy to atmospheric constituents. The energy is directly transferred into objects, or the remote sensing targets. Molecules like ozone, carbon dioxide or water vapor can warm our planet by absorbing energy.
From a remote sensing point of view, the main objective is to use wavelengths that tend to avoid areas in which the absorption is great. Wherever the atmosphere exhibits a high transmissivity for an incoming wavelength, we talk about ‘atmospheric windows‘.
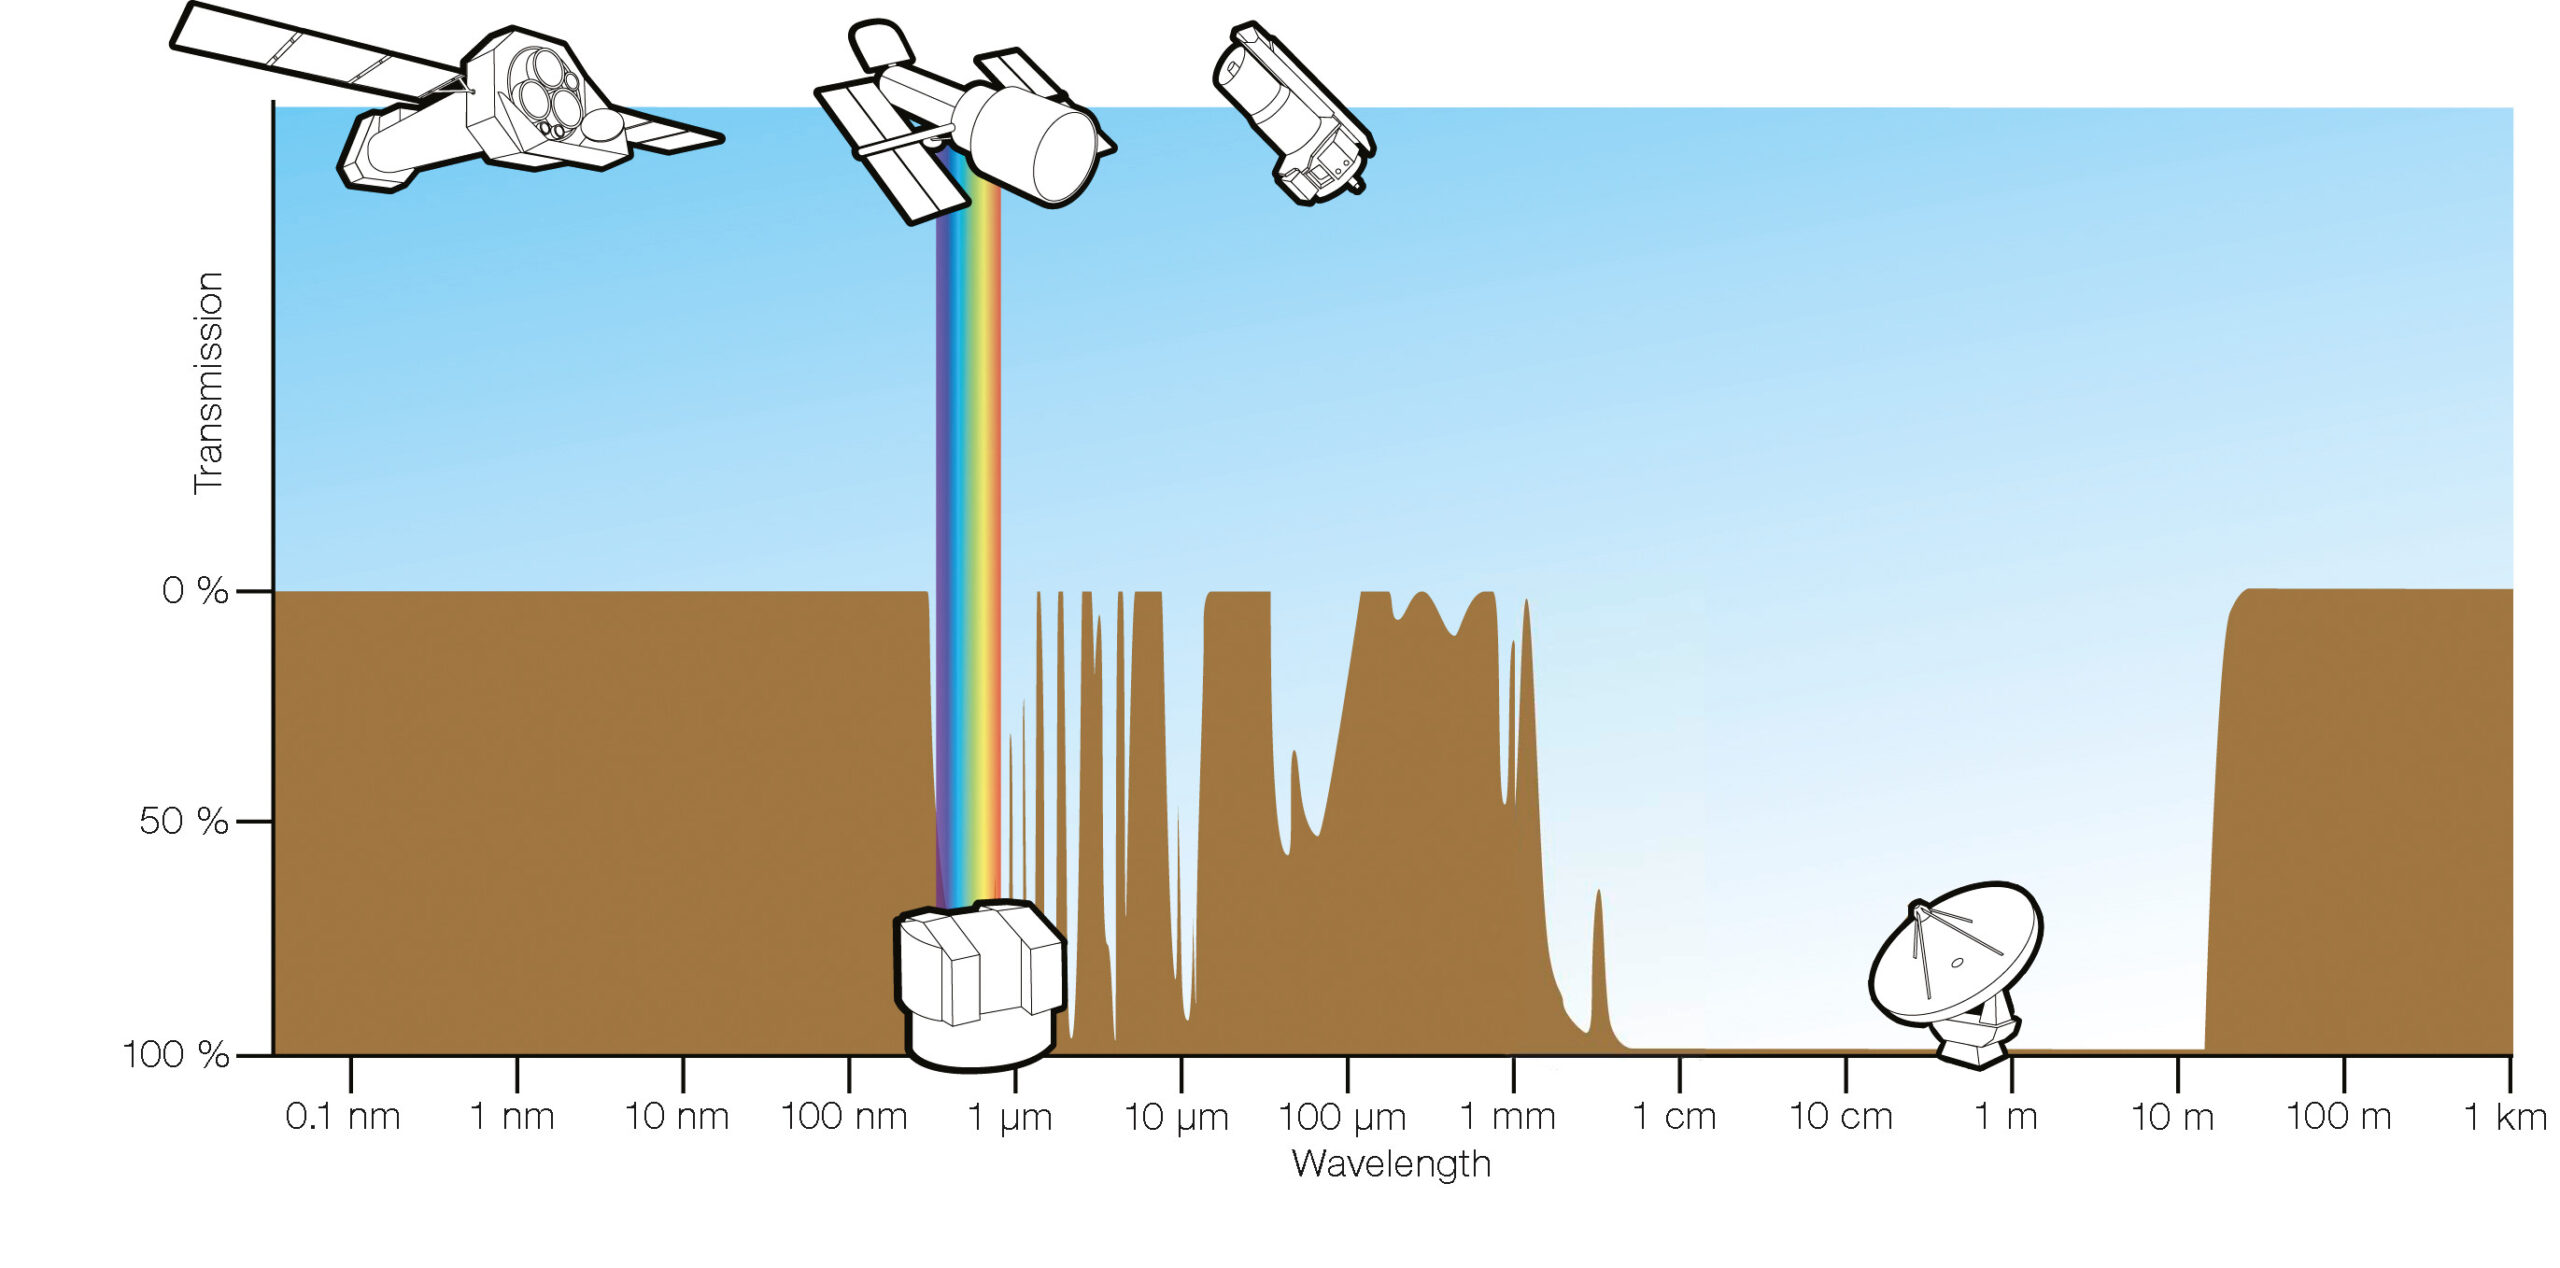
The big atmospheric windows between 1 mm and 1 m allow us to operate microwave systems, which we know as radar sensors. Atmospheric windows in the multispectral portions of the EM spectrum are narrower in comparison.
Keeping this in mind, a lot of caution should be taken when selecting RS instruments and three important questions should be considered carefully:
1.) What is the spectral sensitivity of my sensor?
2.) Which atmospheric windows can be used with this sensor?
3.) What is the source, magnitude and composition of the outgoing signal we are aiming to analyze?
Sources & further reading
Elachi, C. & van Zyl, J. (2015²). Introduction to the Physics and Techniques of Remote Sensing. Hoboken, USA: John Wiley & Sons, Inc.
European Southern Observatory (ESO, 2010). Transparency of the atmosphere. <https://www.eso.org/public/germany/images/atm_opacity/>
Jensen, J.R. (2007²). Remote Sensing of the Environment. An Earth Resource Perspective. Upper Saddle River, USA: Pearson Prentice Hall.
National Aeronautics and Space Administration (NASA) Earth Observatory (EO, 2021). Saharan Dust Heading For Europe. <https://earthobservatory.nasa.gov/images/147952/saharan-dust-heading-for-europe>
Rees, W.G. (2010²). Physical Principles of Remote Sensing. Cambridge, USA: Cambridge University Press.
Schowengerdt, R.A. (2007³). Remote Sensing. Models and Methods for Image Processing. San Diego, USA: Academic Press.
On the Earth’s surface – Reflection and Absorption
LANDMOOC – Basics
Learning objectives of this topic
- How light travels
- Types of reflection
- Absorption & Albedo
- Real-life behavior
Paths of light
Reflection means that something is thrown back. If, for example, a ball is thrown against a wall, and it comes back, one could say that it has been reflected. The same happens with sunlight meeting the surface of the Earth: It is reflected and can thus be collected by a remote sensing sensor. If the light makes contact with a smooth surface, then the angle of incidence equals the angle of reflection.
If light makes contact with a body, it may not necessarily be reflected. It can pass through the body (transmission) or can be refracted (refraction). In case of refraction, the light passes through the body, but changes its propagation direction. However, the most important interactions regarding the principles of remote sensing are reflection and absorption.
Types of reflection
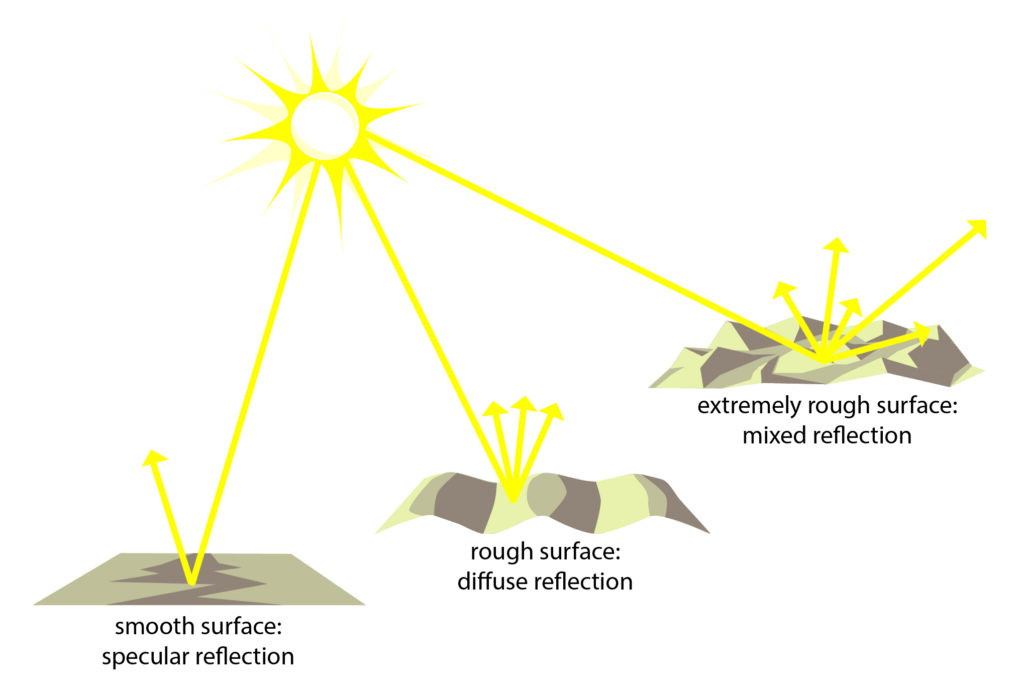
There are three types of light reflections. Note that the reflection depends on the surface roughness of an object.
- Specular (mirror-like) reflection: The light ray meets a smooth surface and the angle of incidence is identical with the angle of reflection.
- Diffuse reflection: The light ray meets a rough surface and is equally reflected in all directions.
- Mixed reflection: The light ray meets a very rough surface and is unequally reflected in all directions. This type of reflection is the most common one in nature!
Absorption and Albedo
Surfaces do not only reflect light; they also (partially) absorb it. In the process of absorption, energy is absorbed by the molecules of a given body and is then transformed into kinetic energy. The increased movement of the molecules produces heat, which is radiated to the surroundings.
The principles of absorption can be observed in daily life: A black t-shirt absorbs more sunlight than a white one. This is the reason we sweat more wearing a black shirt in summer. The albedo of a body is crucial for the percentage of sunlight it absorbs. Albedo measures the degree of reflection of materials in different spectral ranges. An albedo of 100% indicates that no absorption takes place; accordingly, an albedo of 0% indicates no reflection. The table on the right lists values of albedo for different materials in the visible range of light.
As shown in the animation from ESA below, you can see the varying surface reflectance, which is mainly caused by seasonal effects of disappearing snow cover.
| Material | Albedo |
|---|---|
| Snow | 80-90% |
| Cloud | 60-90% |
| Sand | 30% |
| Meadow | 20% |
| Forest | 5-18% |
| Concrete | 15% |
| Water (low angle) | 22% |
| Water (high angle) | 5% |
Behaviour of real-life ‘targets’
In a previous topic, we looked at how the Earth’s atmosphere impacts the radiation, and you also learned which kind of paths the light can take on its course. Now we will take a look at how the radiation interacts with objects or, as we say in a remote sensing perspective, ‘targets’, to better understand what is actually being interpreted in the imagery. As a general note, you should always keep in mind that the way, objects or “targets” reflect, or scatter electromagnetic radiation is always depending on the wavelength that is used. The figures below are simplified to give a sense of how different surfaces interact with EM radiation.
Paved and smooth surfaces
Built-up areas or paved roads are a good example of specular reflection behavior. Another example could be a still water surface or glass/metal objects. Seen as a smooth surface, this area will reflect most of the energy away from its illumination source with a reflection angle that is equal to the incidence angle.

Trees
With a “rougher” surface comes a more diverse reflection scheme. As a rule of thumb, diffuse reflection will dominate, if the wavelength is significantly smaller than the object it hits. As illustrated on the right, a tree is subject to different reflection processes. If microwaves of certain wavelengths (> 10 cm) hit it, they will mainly interact with the tree trunk, as the waves are too big to even recognize the leaves and smaller branches. However, the visible and near-infrared portion of the light spectrum heavily interact with the leaves as well.
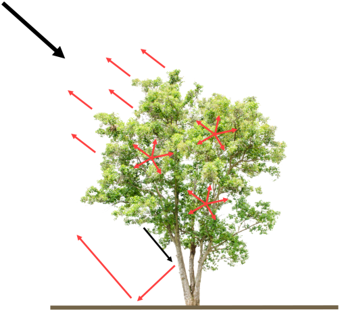
Taking a closer look, we can also explain why leaves appear green to the human eye. Chlorophyll strongly absorbs EM radiation in the red and blue, but reflects the green wavelength. In remote sensing, near-infrared channels are well known for the potential to monitor plant vitality, because the cell structures of healthy vegetation are well-functioning diffuse reflectors.
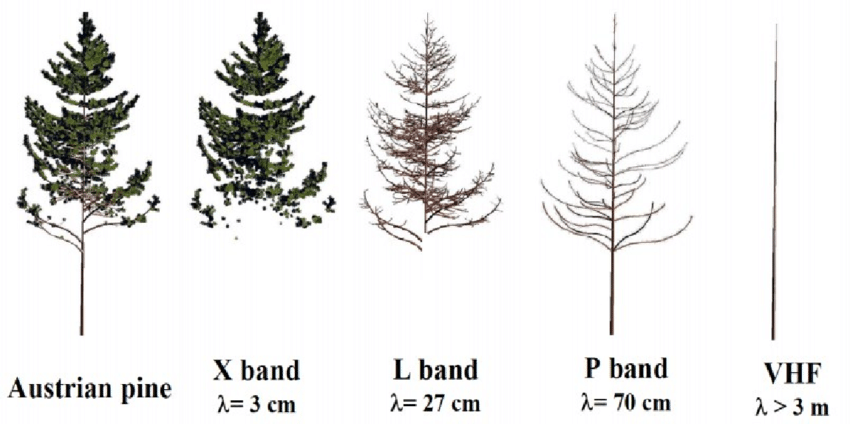
While the figure above shows the behavior of EM radiation in the C-Band (6 cm wavelength), we have to keep in mind that this scheme will change for different wavelengths. As shown on the right, a tree, in this case pine, will look very different to different wavelengths.
Water bodies
Water absorbs mostly longer wavelengths and reflects the shorter ones. Therefore, water surfaces will, if they would not contain any organic matter, appear black (or at least very dark). However, the appearance of water surfaces/body strongly varies with the amount of particles that are present. A very sad but famous case illustrating changes in the reflection of a water body is the shrinking of the Aral Sea, located in Central Asia between Kazakhstan and Uzbekistan. When water levels were high, most of the short radiation was absorbed, but as the levels decreased and the water got more and more shallow, the reflection increased again (brightness increased). The greenish tone of the water originates from algae and the chlorophyll it contains.
By loading the video, you agree to YouTube’s privacy policy.
Learn more
Sources & further reading
Elachi, C. & van Zyl, J. (2015²). Introduction to the Physics and Techniques of Remote Sensing. Hoboken, USA: John Wiley & Sons, Inc.
European Space Agency (ESA, 2013). Earth’s Albedo. <https://www.esa.int/ESA_Multimedia/Videos/2013/08/Earth_s_albedo>.
Jensen, J.R. (2007²). Remote Sensing of the Environment. An Earth Resource Perspective. Upper Saddle River, USA: Pearson Prentice Hall.
National Aeronautics and Space Administration (NASA) Earth Observatory (EO, 2018). World of Change: Shrinking Aral Sea. <https://earthobservatory.nasa.gov/world-of-change/AralSea>.
Rees, W.G. (2010²). Physical Principles of Remote Sensing. Cambridge, USA: Cambridge University Press.
Schowengerdt, R.A. (2007³). Remote Sensing. Models and Methods for Image Processing. San Diego, USA: Academic Press.