

By loading the video, you agree to YouTube’s privacy policy.
Learn more
- What are the main challenges we are faced with around food security?
- What are the main strategies to supply more food? (expansion vs. intensification)
- How can the challenges be mapped globally?
- What are examples of agricultural intensification/expansion?
- How are certain challenges mapped with geospatial tools (e.g. population density)?
The use of EO and Geoinformation can be used to improve food security and improve the management of food systems by:
- Quantifying the problem
mapping where yields are lower than expected (an example related to increasing low yields) - Supporting informed decisions that adress the problem
mapping the factors (like soil) that explain why yields are low - Guiding action- where and when to act upon those decisions
guiding where to use improved varieties and better management methods - Measuring the impact of those actions
mapping yields before and after the interventions - Monitoring the progress & improve the management of food systems
monitoring yields over time and comparing the impact of different interventions
Some Examples of EO data & tool utilization for food security
A farmsourcing platform for a smart nitrogen management
A shortage of Nitrogen (N) results in lower yields, whereas an excess has negative environmental consequences.
The BELCAM collaborative platform contributes to smart nitrogen management of wheat, potato and maize in Belgium by providing users satellite-based N recommendations at parcel level. Growing-season specific data are produced from reflectances and vegetation indices derived from Sentinel-2.
Click to read more: NEREUS 2018, pp 60-61 @Belcam
GEOGLAM Crop Monitor for Early Warning (CM4EW)
Crop condition information is crucial in countries at risk of famine. Early warning is often critical to trigger early action by humanitarian and aid organizations.
The CM4EW builds on operational regional and global crop monitoring systems and provides a common platform to create consensus and reduce uncertainty across systems. Satellite-based indicators help monitor crop condition globally. These include NDVI and NDVI anomalies, the Evaporation Stress Index, temperature anomalies, precipitation anomalies, and evapotranspiration anomalies.
Click to read more: Storymap with explanations
Economic growth
[availability]
growth in the middle class due to poverty reduction,
Increased demand for meat and dairy products that s not sustainable
Climate change
[stability]
price shock due to more frequent ‘extreme weather’ conditions
Rapid urbanization
[availability & access]
Rapid urbanization rates in Africa and Asia
Increase demand for affordable food & infrastructure to deliver, store, provide.
Economic growth
[availability]
growth in the middle class due to poverty reduction,
Increased demand for meat and dairy products that s not sustainable
Increased consumption
[utilization]
price shock due to more frequent ‘extreme weather’ conditions
malnutrition and knock on effects in health, development, and the economy
Food Safety
[utilization]
limited resources to manage and monitor food chains and businesses (COVID-19)
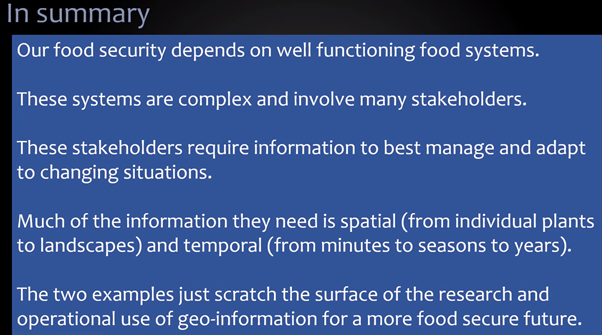
Where are we going?
Sources & further reading
Buiten, H. J., & Clevers, J. G. P. W. (1993). Land observation by remote sensing: theory and applications. Current topics in remote sensing, 3. Reading, UK: Gordon and Breach Sci. Publ.
Elachi, C. & van Zyl, J. (2015²). Introduction to the Physics and Techniques of Remote Sensing. Hoboken, USA: John Wiley & Sons, Inc.